
Can We Get Out?
CYCLES OF CAPITAL - Part 3/3
Follow The Money

CHRIS
I can’t move.
MISSY
You can’t move. That’s good.
Now sink into the floor.
CHRIS
Wait I--
MISSY
Sink.
In 1985, a median American home cost about $83,000 and the median household earned about $24,000 a year. That’s a ratio of roughly 3.5 to 1. A home cost three and a half years of your life. Uncomfortable, but reachable. By 2025, the median home costs $417,000 and the median household earns $83,000. The ratio has climbed to 5 to 1 — and in Los Angeles it’s 12.5, in San Jose it’s 10.5, in New York it’s nearly 10. Home prices have risen 415% over forty years. Incomes rose 255%. The gap is accelerating.
The S&P 500 returned over 800% in its lifetime. What did that deliver to the person in the middle of the income distribution? Not 800% of anything. Not 400%. Not even close. The median worker’s real compensation rose roughly 16% over forty years while productivity climbed 60%. Where did the other 44% go? It went up. It went into corporate profits, executive compensation, shareholder returns, and the asset prices that only matter to people who already own assets.
The story of how we got here spans roughly seventy years. It starts with a post-war miracle that was deliberately dismantled through tax policy, deregulation, union-breaking, and the financialisation of everything. It accelerates through a crisis consolidation playbook that turns every downturn into a buying opportunity for those with liquidity and a wipeout for those without. And it reaches its current velocity through artificial intelligence, which arrived at the precise moment when all of these dynamics were already at extremes, compressing the next phase of concentration into years rather than decades, creating a cognitive divide between those who own the intelligence infrastructure and those who are subject to it.
If you have read the first two parts of this series, you know the mechanisms. If you haven’t, the short version is: the system was redesigned on purpose, over decades, by identifiable people, through identifiable policy choices, and the results are exactly what you would expect if you understood the design.
This piece is about where the money ended up.
Not as a chart or a Gini coefficient but as a map of human lives, tier by tier, from the 40 million Americans below the poverty line to the roughly 800 billionaires who now collectively hold more wealth than the bottom 95% of humanity combined.
Seven Tiers
There are approximately 330 million people in the United States. They do not live in one economy. They live in several, stacked on top of each other, increasingly disconnected, speaking different financial languages, eating different food, sending their children to different schools, and dying at different ages. The numbers that follow are approximations. The experiences they describe are not.
The table below summarises the structure. What follows describes what it feels like to live inside it.
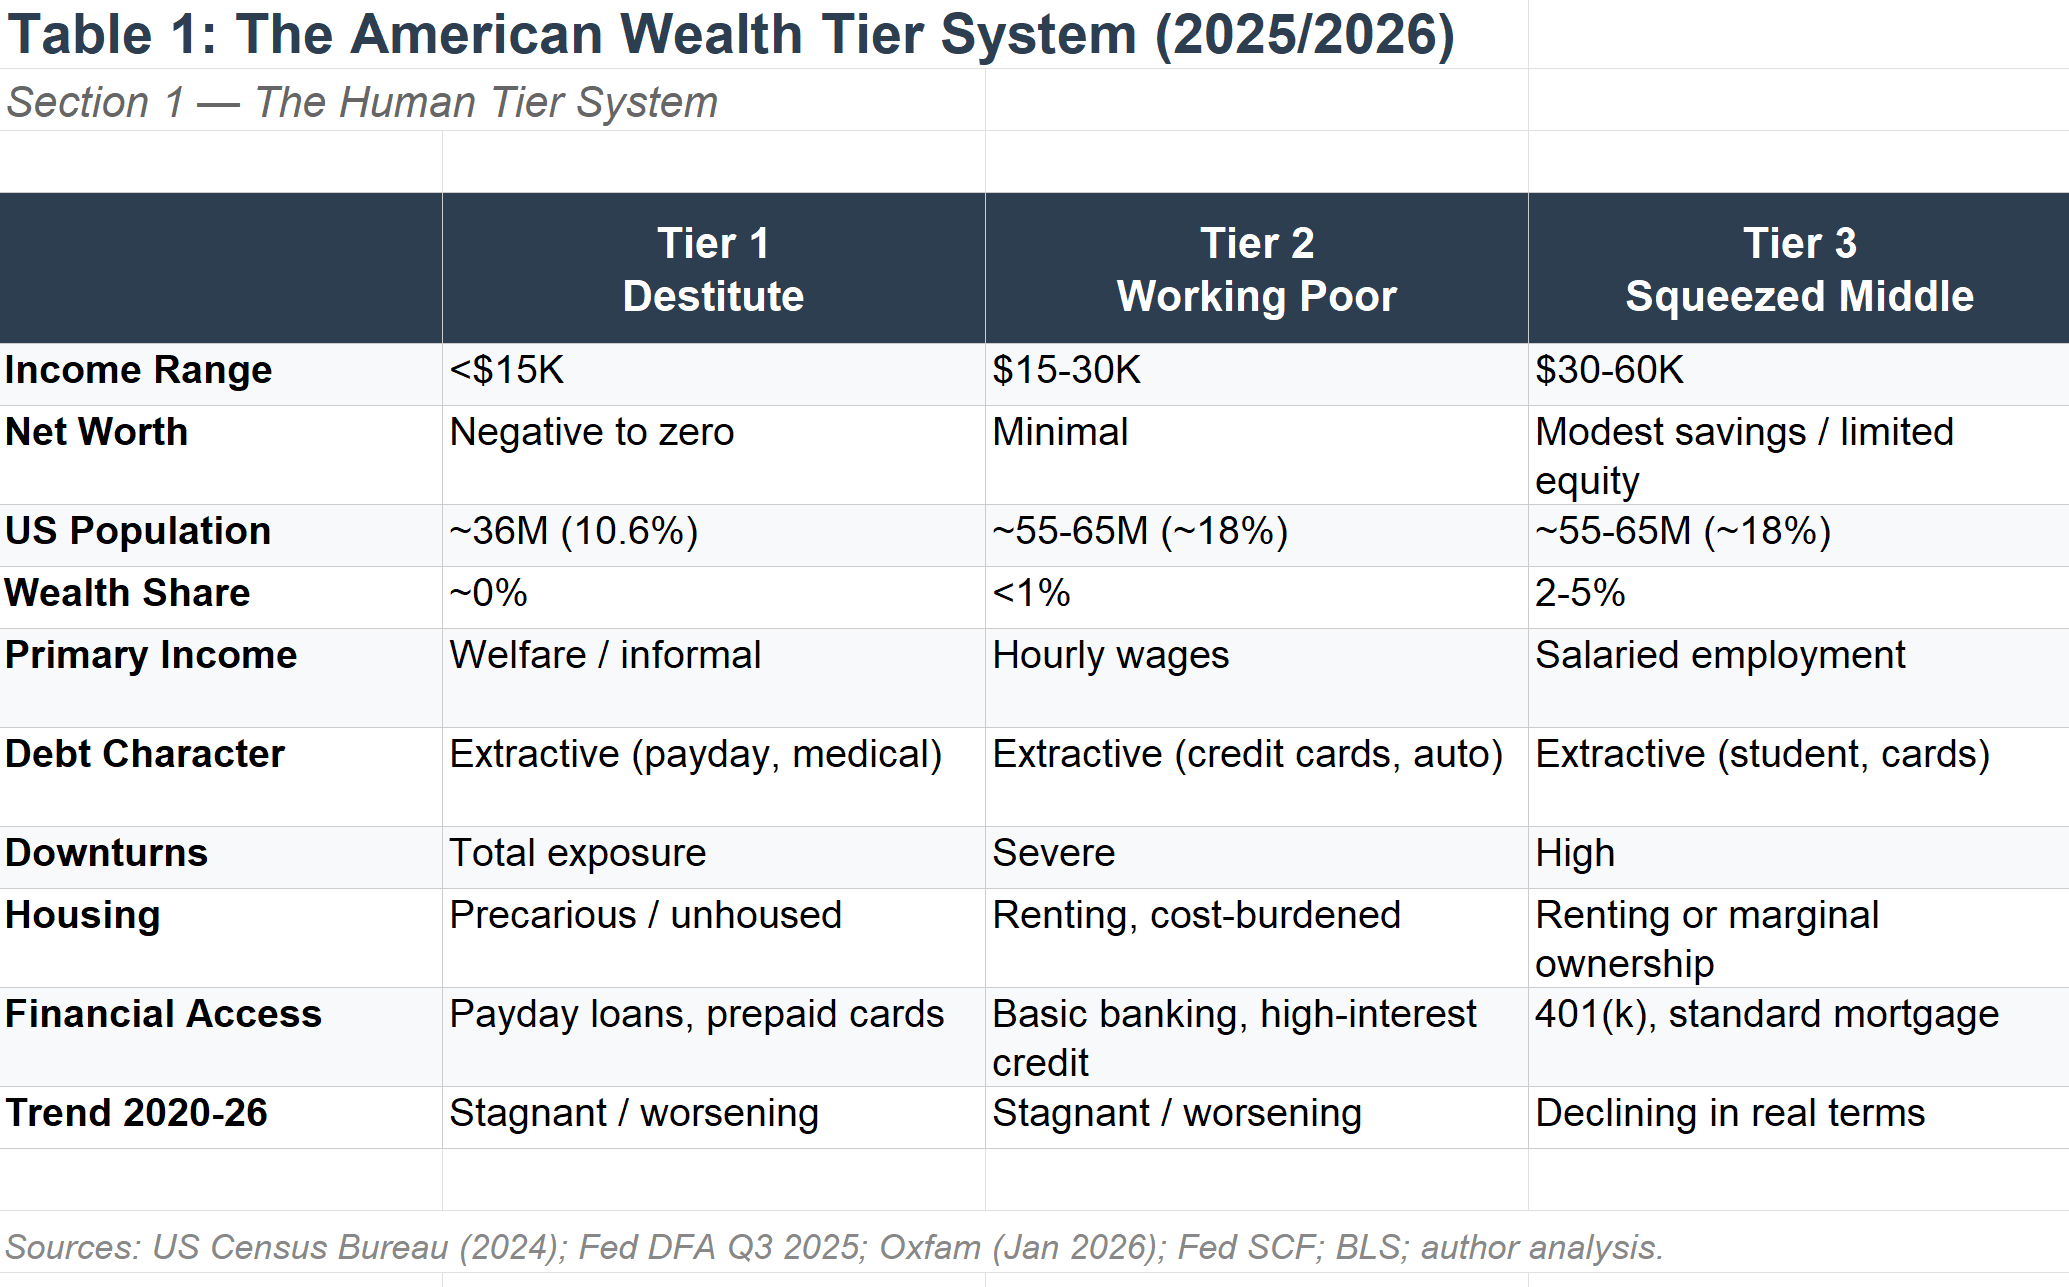
Sources: US Census Bureau (poverty data, 2024); Federal Reserve Distributional Financial Accounts (Q3 2025); Oxfam “Resisting the Rule of the Rich” (January 2026); Federal Reserve Survey of Consumer Finances; Bureau of Labor Statistics; author’s analysis based on Cycles of Capital framework. Population estimates are approximate and tiers are illustrative rather than precisely bounded. Wealth share figures reflect Fed DFA data for top 1% (31.7%) and top 10% (~65%), with lower-tier breakdowns estimated from SCF distributions.
Tier 1 — The Excluded (~36 million people)
Income below $15,000 a year. Net worth negative or functionally zero. This tier includes people who are unhoused, food-insecure, dependent on welfare systems that are being algorithmically enforced and systematically defunded. The official poverty rate in the United States was 10.6% in 2024, covering 35.9 million people, though the Supplemental Poverty Measure, which accounts for actual living costs, puts the figure closer to 12.9%. A $400 emergency, the kind that most Americans will face at least once a year, is not a setback at this level. It is a catastrophe. It means choosing between the electricity bill and the medication. It means a payday loan at 400% APR that takes months to escape, if you ever do.
Children grow up in this tier. The child poverty rate in the United States was 14.3% in 2024. These children attend schools funded by local property taxes, which means the poorer the neighbourhood, the worse the school. They eat meals subsidised by SNAP, which have been converted to block grants with algorithmic work requirements designed to purge recipients from the rolls. They live in housing that is precarious, loud, and often unsafe. The phrase “upward mobility” is a concept from another country.
This tier holds approximately zero percent of the nation’s wealth.
Tier 2 — The Working Poor (~55-65 million people)
Income between $15,000 and $30,000 a year. Assets: a car, maybe, almost certainly depreciating. Savings: enough for a few weeks, if that. These are the people stocking shelves at 5am, cleaning offices at midnight, driving deliveries in their own vehicles, picking crops, building houses they will never live in. Many are immigrants doing the work that the economy depends on and the political system scapegoats them for.
Debt at this level does not build anything. It extracts. Credit cards at 22-24% interest. Medical bills from a system that charges $800 for an ambulance ride. Auto loans on vehicles they need to get to the jobs that don’t pay enough to service the auto loans. The average credit card balance for households earning under $35,000 has been rising steadily, because when wages don’t cover essentials, plastic fills the gap. That gap charges interest.
Homeownership is out of reach. Rent consumes 40-50% or more of income. A job loss, an illness, a rent increase: any one of these can push a Tier 2 household into Tier 1 within weeks. The floor is right there. Everyone can feel it.
This tier holds less than 1% of the nation’s wealth.
Tier 3 — The Squeezed Middle (~55-65 million people)
Income between $30,000 and $60,000. A retirement account with a few thousand in it. Maybe some equity in a home, if they bought before 2020 and haven’t been forced to refinance. This was supposed to be the American Dream. It was supposed to be the tier where effort started to pay off, where a degree led to a career, where you could put something aside for your kids.
Student debt sits at $1.77 trillion nationally. Much of it is concentrated here. The degree was supposed to be the ladder. The ladder is now the debt. Delinquency rates on student loans hit 9.6% in Q4 2025, with approximately one million borrowers transferred to the Default Resolution Group. For many households in this tier, the resumption of student loan payments was the thing that snapped an already strained budget.
Productivity in the American economy has risen roughly 60% since 1979. Hourly compensation for workers in this tier rose about 16% over the same period. The gap between those two numbers represents the largest transfer of value from labour to capital in modern history. Tax cuts, deregulation, union-breaking, financialisation. Part 1 documented all of it.
People here are one bad year from Tier 2. They know it. That knowledge shapes everything: risk aversion, political anxiety, susceptibility to narratives that offer someone to blame. When a politician points at immigrants and says “that’s why you’re struggling,” this is the tier where it lands hardest, because the struggle is real even if the explanation is a lie.
This tier holds roughly 2-5% of the nation’s wealth.
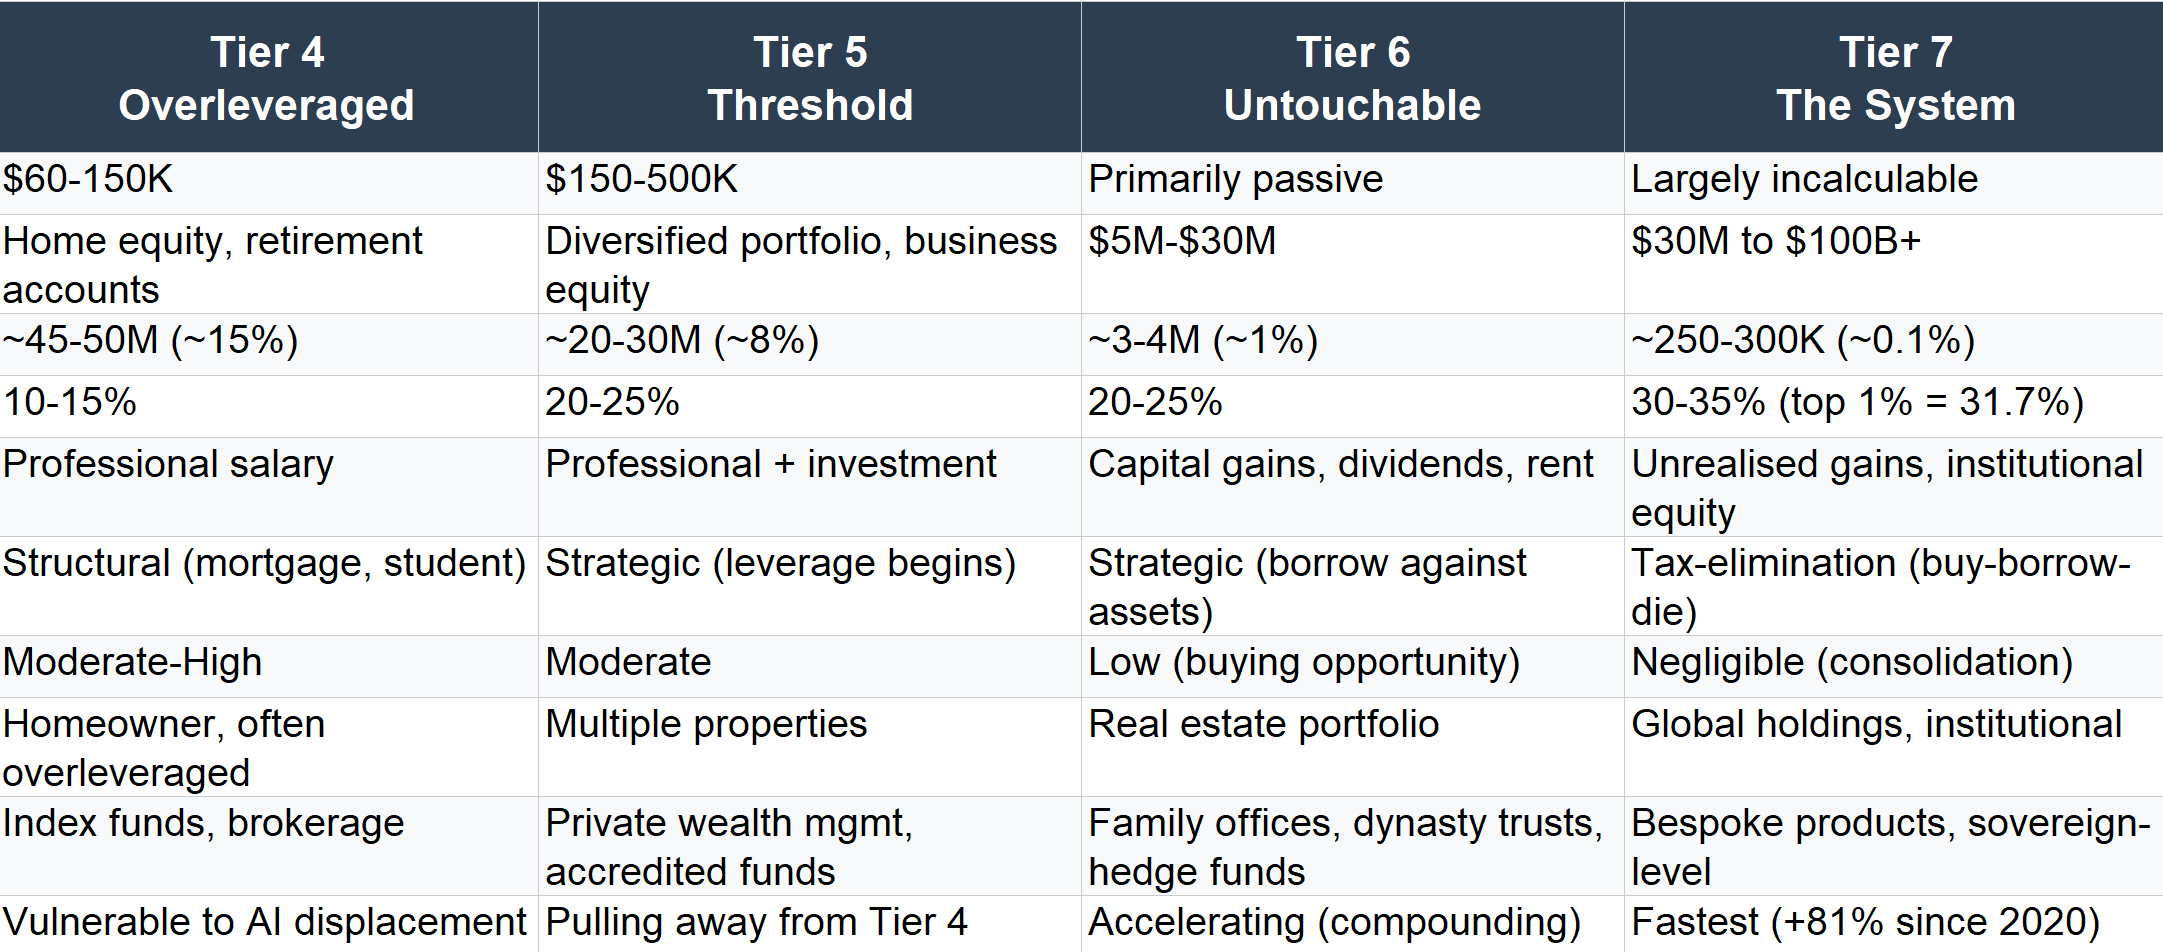
Tier 4 — The Overleveraged Comfortable (~45-50 million people)
Income between $60,000 and $150,000. Homeownership, usually. A 401(k) that looks reassuring on paper. Decent health insurance through an employer. Occasional holidays. Private school if they stretch. The outward appearance of prosperity.
But the prosperity is leveraged. The home is the single largest asset, and a market correction of 15-20% wipes out years of equity. The retirement account is invested in index funds that are 40% concentrated in ten companies, all betting on the same AI thesis. The health insurance is tied to an employer who is “restructuring.” The children’s college fund is a fraction of what tuition will cost.
This is the tier that the economy measures. When economists say “the consumer is resilient,” they are often talking about this group and the one above it. Their spending keeps retail afloat. Their mortgages keep banks solvent. Their 401(k) contributions keep the S&P 500 inflated. They are the structural load-bearing wall of the entire economic narrative.
They are also the tier most exposed to the AI displacement documented in Part 2 of this series. Entry-level white-collar jobs, the stepping stones into this tier, are being eliminated. Junior analysts, associate lawyers, marketing coordinators, copywriters. Stanford’s research found a 13% employment drop among 22-25 year olds in AI-exposed roles since late 2022. The rungs at the bottom of this ladder are disappearing while people are still climbing.
This tier holds roughly 10-15% of the nation’s wealth.
Tier 5 — The Threshold (~20-30 million people)
Income between $150,000 and $500,000. Diversified investments. Business equity. Perhaps a second property. Access to a financial advisor rather than a banking app.
Here is where the qualitative shift begins. Below this tier, money is functional. You use it to live. It flows in and flows out. You trade time for it. Above this tier, money starts to work while you sleep. It compounds. It generates more of itself through mechanisms that have nothing to do with effort.
This is the door to the leverage loop described in Part 1. If you own $500,000 in appreciating assets, a bank will lend against them at rates that a Tier 2 household could never access. The loan is not income nor is it taxed. Your assets continue to appreciate. You are now operating within a different financial physics. Capital gains are taxed at 20%. Ordinary income, the kind that comes from working, is taxed at 37%. The tax code is telling you, in plain arithmetic, that owning is worth nearly twice as much as doing.
This tier is pulling away from the tiers below it. The gap between Tier 4 and Tier 5 is widening faster than the gap between Tier 3 and Tier 4, because the mechanisms of accumulation are multiplicative at this level. The same passive index fund concentration that squeezes the Russell 2000 (documented in The Number Is Going Up) enriches Tier 5 portfolios through the same mathematical inevitability.
This tier holds roughly 20-25% of the nation’s wealth.
Tier 6 — The Untouchable (~3-4 million people)
Net worth between $5 million and $30 million. Income primarily passive: capital gains, dividends, rental income, business distributions. This tier has left the conventional economy entirely. They don’t check their bank balance before buying groceries. They don’t think about whether they can afford the holiday. They don’t know what a payday loan is, except as an abstraction in a policy document they might skim.
Family offices manage their wealth. Dynasty trusts ensure it passes to the next generation without the inconvenience of estate taxes. Private banks offer products that don’t exist below this level: bespoke lending facilities, alternative asset access, tax-optimised debt structures that let them live on borrowed money while their assets appreciate untouched.
This tier is functionally beyond the reach of economic fluctuation. A recession is not a threat at this level. It is a buying opportunity. The crash described in Part 1 (Blackstone purchasing 50,000 foreclosed homes) was executed by capital from this tier and the one above it.
This tier holds roughly 20-25% of the nation’s wealth. About 1% of the population.
Tier 7 — The System (~250,000-300,000 people, and within them, ~800 billionaires)
Net worth $30 million to $100 billion and beyond. These individuals do not participate in the economy. They are the economy… Their capital allocates markets, shapes political discourse, funds the think tanks that write the policy, owns the platforms that distribute the information, and employs the lobbyists who ensure the rules remain favourable.

JIM
Ignorance...
CHRIS
Who?
JIM
All of them.
They mean well but they have no idea what real people go through.
CHRIS
I guess people only see what’s in front of them.
The top 1% of American households now hold 31.7% of all wealth, the highest share since the Federal Reserve began tracking in 1989. The top 10% hold approximately 65%. The bottom 50% hold about 2.5%.
Globally, the picture is starker. Oxfam’s January 2026 report found that billionaire wealth reached a record $18.3 trillion, growing 16% in a single year, three times faster than the five-year average. Since 2020, billionaire wealth has increased 81%. The twelve richest billionaires now own more than the poorest half of humanity. Four billion people. The $2.5 trillion added to billionaire fortunes last year would be enough to eradicate extreme poverty 26 times over.
And here is the number that should stop you: billionaires are 4,000 times more likely to hold political office than ordinary citizens. They own more than half the world’s largest media companies and all the main social media platforms.

JIM
Okay, then let me just tell you what it is.
Phase one was the hypnotism. That’s how they sedate you.
Phase two is this. Mental preparation.
It’s basically a psychological pre-op.
In the United States, the Trump cabinet is the wealthiest in American history, with a combined net worth measured in hundreds of billions. The people at the top of the economic architecture are now running the government that is supposed to regulate them.
Do you know the difference between a million dollars and a billion dollars? It is approximately a billion dollars. A million seconds is twelve days. A billion seconds is thirty-two years. The human brain cannot intuitively grasp the difference. Which is part of how it persists.
Would a million dollars drastically change most of our lives? Yes. Would you be able to spend a billion dollars if it were your full-time job? Probably not. And yet the system treats the accumulation of the latter as not only normal but aspirational, and protects it with more legal infrastructure than most countries devote to public health.
The new dimension is intelligence itself. AI is trained on public knowledge and refined through interaction with the public, but the most capable versions are gated by cost and exclusivity. Capital buys intelligence. Intelligence generates capital through superior systems across business, finance, legal strategy, and logistics. Capital reinvests in intelligence development, including customisation that is unavailable at the consumer tier. The cycle repeats, each iteration widening the gap.
This is the current operating model of the AI economy, and it is the leverage loop from the 1980s rewritten for the 2020s, running at the speed of inference rather than the speed of legislation.
The Break
There is a qualitative discontinuity between Tier 5 and Tier 6 that the numbers alone cannot convey. Below that line, wealth is fragile. It depends on wages, on employment, on health, on the housing market, on interest rates, on whether the company restructures. It can be wiped out by a divorce, a diagnosis, a downturn. People below that line play by one set of financial rules. The rules are punitive. Default means foreclosure. Missed rent means eviction. An illness means bankruptcy. There is no asset reallocation strategy for people who own no assets.
Above that line, wealth becomes self-sustaining. It reproduces through structure: compounding returns, institutional scaffolding, legal architectures designed to prevent erosion, and a tax code that rewards ownership almost twice as generously as labour. Losses at this level are absorbed, diversified, negotiated. Crises are opportunities. The people above the line don’t need the economy to be healthy. They just need it to keep producing assets they can buy.
And here is the part that should worry everyone: this is no longer just an economic divide. When the tools of thought, analysis, prediction, and decision-making are themselves gated by wealth, the divide stops being purely financial. It becomes epistemic. It becomes about who gets to understand the world accurately, and who gets a filtered, managed, nudged version of reality shaped by someone else’s interests. The same AI that serves as a concierge for Tier 7 serves as a warden for Tier 2. Same technology. Opposite function.
Two sets of rules. One word for both: economy.
The tier system described above accounts for the wealth that is visible. The wealth that shows up in tax returns, census data, Federal Reserve surveys, and Forbes lists. There is another category of wealth that does not appear in any of these. It sits in jurisdictions designed to make it invisible: the British Virgin Islands, the Cayman Islands, Panama, Luxembourg, Switzerland, Jersey, Bermuda, and dozens of others. It is held through shell companies, trusts, foundations, and layered corporate structures whose purpose is to separate the money from the name of the person who owns it.
The Tax Justice Network has estimated that between $21 trillion and $32 trillion in private financial assets are held offshore. To put that in context: total US GDP in 2025 was roughly $29 trillion. The offshore system holds wealth equivalent to the entire annual economic output of the world’s largest economy, and possibly more. Nobody knows the exact figure, because the entire point of the architecture is to make precise measurement impossible.
Three Leaks, One Architecture
Between 2016 and 2021, three massive data breaches pulled back the curtain on this system. Collectively, they represent the largest exposure of hidden wealth in history. They revealed a lot about the behind-the-scenes financial behaviour of the global elite.
The Panama Papers, published in April 2016, consisted of 11.5 million documents from the Panamanian law firm Mossack Fonseca. The files detailed the creation and management of over 214,000 offshore entities linked to people in more than 200 countries. They exposed heads of state, close associates of Vladimir Putin, the family of Pakistan’s prime minister, and hundreds of other politicians, athletes, and business figures using secretive structures to hide assets, avoid taxes, launder money, and evade sanctions. Iceland’s prime minister resigned within days. Mossack Fonseca shut down in 2017. In 2024, a Panamanian court acquitted all 28 defendants on money laundering charges, citing insufficient evidence and chain-of-custody issues with the leaked data.
The Paradise Papers followed in November 2017: 13.4 million files, primarily from the Bermuda-based law firm Appleby. These documents revealed how Queen Elizabeth II’s private estate had invested millions through offshore funds, how Trump’s Commerce Secretary Wilbur Ross held stakes in a shipping company linked to Russian oligarchs despite sanctions concerns, and how Apple had engineered massive offshore profit shifts to Jersey to avoid billions in taxes. The EU later ruled that Apple owed Ireland over $14 billion in back taxes.
The Pandora Papers, published in October 2021, were the largest of the three: 11.9 million documents from 14 different offshore service providers. They linked 35 current and former world leaders, over 330 politicians from nearly 100 countries, and more than 130 billionaires to offshore structures. King Abdullah II of Jordan had secretly acquired a $100 million property empire through dozens of shell companies. The then-Czech prime minister had bought a $22 million French Riviera chateau through offshore firms while publicly campaigning against elite corruption.
Taken together, these three leaks exposed over 36 million documents and hundreds of thousands of offshore entities. They revealed a financial architecture used systematically by the wealthiest people on earth to move money beyond the reach of democratic accountability.
Table 2: Three Leaks, One Architecture
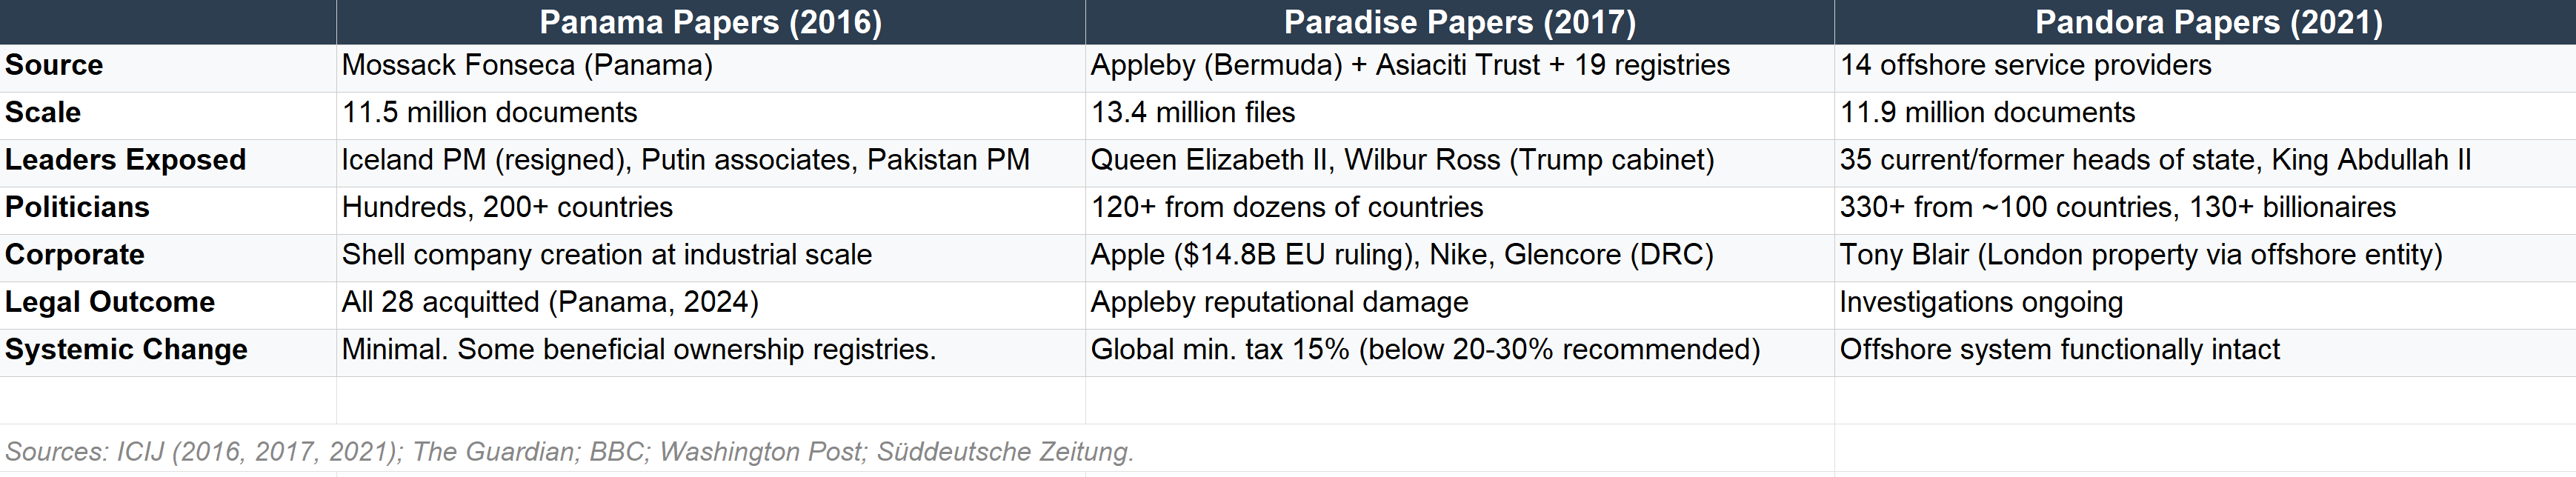
Sources: ICIJ investigations (2016, 2017, 2021); individual case reporting via The Guardian, BBC, Washington Post, Süddeutsche Zeitung.
What Changed
Almost nothing.
Nine years after the Panama Papers were published, governments worldwide have recovered approximately $1.86 billion in back taxes and penalties from the revelations. That sounds significant until you measure it against the scale of the problem. The Tax Justice Network’s 2024 State of Tax Justice report found that countries lose approximately $492 billion per year to global tax abuse: $348 billion from multinational corporations shifting profits offshore, and $145 billion from wealthy individuals hiding wealth. The 2025 report found that over a six-year period, countries lost a cumulative $1.7 trillion to corporate tax abuse alone, with US-headquartered multinationals responsible for 29% of the total.
$1.86 billion recovered. $492 billion lost every year. The recovery represents roughly 0.4% of one year’s losses. At this rate, it would take over 250 years to recover what is lost in a single year. And the losses compound.
Table 3: The Offshore Recovery Gap
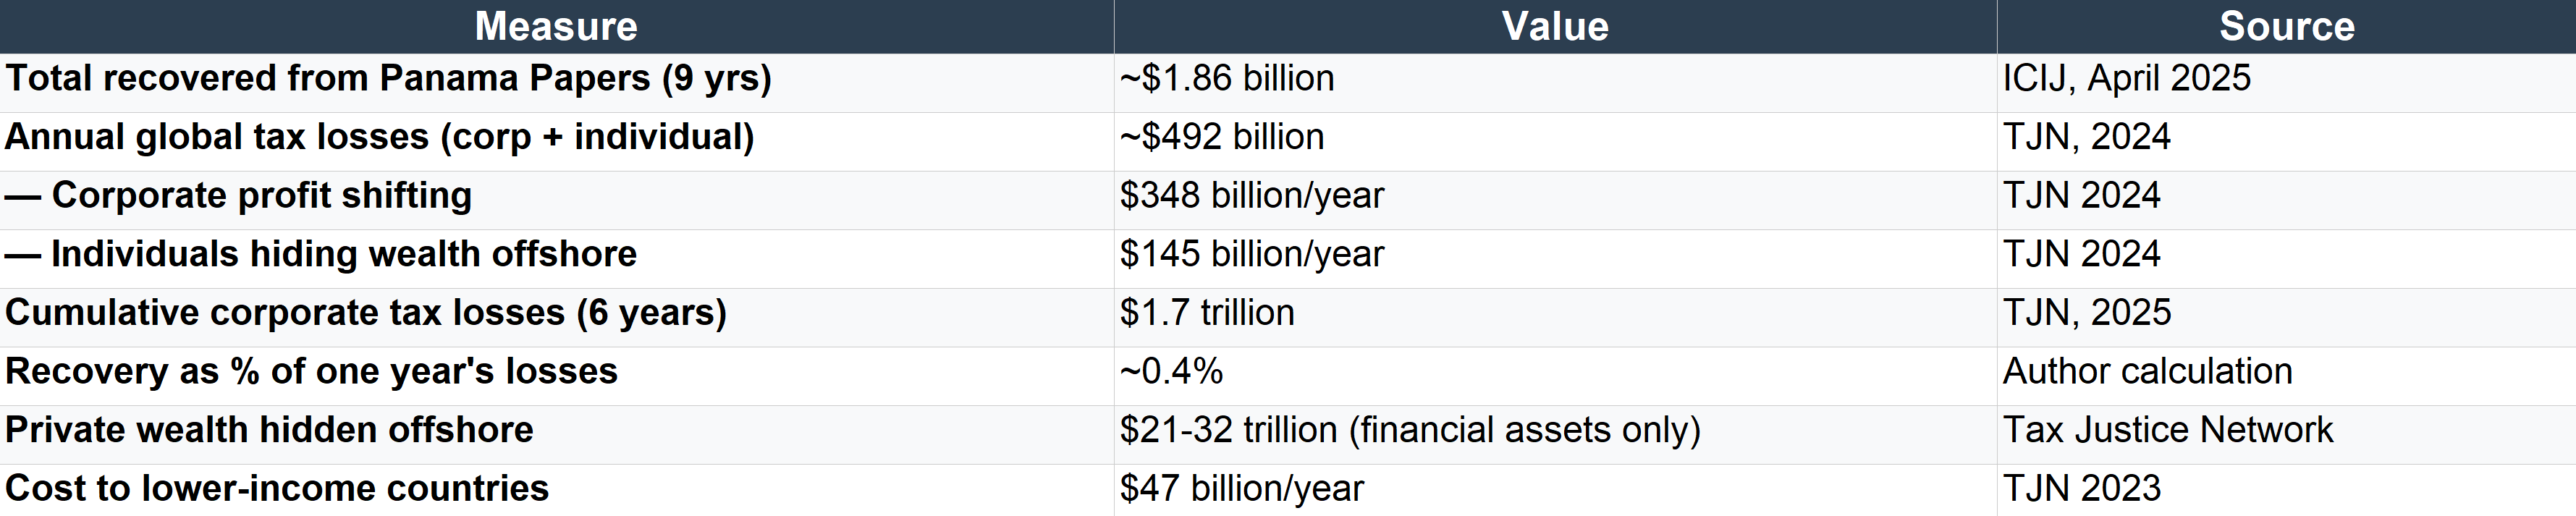
The $21-32 trillion estimate covers financial assets only. Including international real estate, private art, precious metals, private equity, cryptocurrency, and other non-financial assets, the true total is substantially higher. The Tax Justice Network describes this as a floor, not a ceiling.
These tax havens did not emerge by accident. As the historian Vanessa Ogle has documented, and the Oxfam briefing paper on global oligarchy makes explicit, many of the world’s secrecy jurisdictions were originally constructed by Northern bankers, lawyers, and consultants to allow British and French settlers in the Caribbean and across Africa to shield their wealth from decolonisation. Offshore finance is, in its origins, a colonial instrument repurposed for the global age. The same jurisdictions that once protected colonial extraction now protect billionaire extraction. The mechanism is continuous. Only the clients have changed.
The journalist who did the most to expose the offshore architecture in Malta, Daphne Caruana Galizia, was assassinated on October 16, 2017. A car bomb, remotely detonated. She was 53. She had used the Panama Papers to expose corruption ties between Malta’s prime minister’s inner circle and offshore shell companies. A public inquiry concluded that the Maltese state bore responsibility for creating a climate of impunity that enabled the murder. Her killers have been convicted. The alleged mastermind, a wealthy businessman with ties to the political elite, was controversially granted bail in 2025. No one has been definitively convicted as the ultimate order-giver.
She was killed for reporting on the architecture. The architecture however, still remains.

How It Works
The offshore system operates through a set of mechanisms that are individually legal and collectively devastating. Understanding them requires stripping away the complexity that has been deliberately constructed to discourage scrutiny.
Shell companies are legal entities that exist on paper but conduct no real business. They are created in jurisdictions that do not require the disclosure of the actual owner. A person in London or New York can set up a company in the British Virgin Islands, register it through a nominee director in Panama, open a bank account in Switzerland, and hold assets that are functionally invisible to the tax authorities of any country where the actual owner lives or earns money. The company exists. The assets exist. The connection between them and the person who benefits from them is obscured behind multiple layers of legal fiction.
The opacity extends beyond tax avoidance into the networks of power themselves. Recently released Epstein files and investigative reporting by DER STANDARD revealed that Jeffrey Epstein invested $40 million in venture capital funds co-founded by Peter Thiel ’s (Valar Ventures), including more than $2.5 million that financed the German online bank N26.

CHRIS
It’s so weird, man. It’s like some of these people never met a black dude that doesn’t work for them.
Peter Thiel has publicly stated that he no longer believes freedom and democracy are compatible, and his political network (which he has poured funding into for over a decade) includes Vance, the Vice President of the United States. The financial systems that hide wealth also obscure the relationships between the people who own them. When those relationships include figures at the intersection of intelligence networks, political power, and technology development, the opacity is the point, not a side effect.
Jurisdictional arbitrage exploits the differences between countries’ tax codes and transparency requirements. A corporation earns revenue in the United States, routes it through an intellectual property holding company in Ireland (where the effective rate is lower), then shifts it again to a subsidiary in Luxembourg or the Netherlands, and parks the residual in a Bermuda entity where it faces no taxation at all. Each step is technically legal. The cumulative effect is that profits earned from American consumers, using American infrastructure, employing American workers, are taxed at a fraction of the statutory rate or not taxed at all. Apple’s profit-shifting arrangements through Ireland, exposed in the Paradise Papers, resulted in an EU ruling that the company owed Ireland $14.8 billion in back taxes. Apple appealed. The case took years to resolve.
The revolving door ensures that the people writing tax law and the people exploiting it often share employers, conferences, and social networks. Tax lawyers move between government posts and private practice. Accountants at the Big Four firms advise governments on policy while simultaneously advising their wealthiest clients on how to avoid the policies they helped design. The OECD, which has led international tax reform efforts, has faced concerns about corporate influence over its processes and a revolving door with the private sector. An academic study of submissions to the OECD during the drafting of tax standards concluded that business groups had more influence on the final text than civil society organisations.
The Best Investment Return in History
Oxfam’s analysis of the 50 largest US public corporations found that for every $1 they spent on lobbying between 2008 and 2014, they received $130 in tax breaks and more than $4,000 in federal loans, loan guarantees, and bailouts.
A dollar spent on lobbying returned over four thousand dollars in government-backed financial support... it doesn’t sound like capitalism or a free market. This is a system in which public resources are converted into private wealth through the legal purchase of political influence, and the return on that purchase exceeds anything available in any asset class, in any market, anywhere in the world.
In 2022, the 182 largest US public corporations spent a collective $746 million on lobbying. The investment is rational. The return is extraordinary. The cost is borne by everyone who pays taxes, uses public services, or lives in a society that underfunds its schools, bridges, and hospitals so that the wealthiest corporations can extract a few more points of margin.
This is the mechanism. The offshore architecture hides the money. The lobbying system protects the rules that allow the hiding. And the tax code ensures that the people who benefit most from the system contribute least to maintaining it. Capital gains taxed at 20%. Ordinary income taxed at 37%. Unrealised gains taxed at 0%, indefinitely, until death erases them through the stepped-up basis. For every dollar that crosses the line into Tier 6 and above, the system provides an escalating series of protections designed to ensure it never comes back down.
Fifty Years of Tax Cuts
The argument for this arrangement has been remarkably consistent for half a century: lower taxes on the wealthy will generate economic growth that benefits everyone. The money will trickle down. The corporations will invest. The jobs will appear.
Companies reinvested profits into the business, into workers, into research and development. The tax code shaped a culture of reinvestment. Reagan’s cuts reshaped a culture of extraction. Every subsequent administration, with minor exceptions, continued the trajectory. The template set in 1981 has never been fundamentally reversed.
An academic review of 50 years of tax cuts for the rich across 18 countries, published in the Socio-Economic Review in 2022, found that these promises never materialised. The only measurable impact was increased inequality.
Fifty years. Eighteen countries. The same experiment, repeated. The same result, ignored. The policy continues because the people who benefit from it are the same people who fund the campaigns, staff the advisory boards, own the media organisations, and now sit in the cabinet. The empirical evidence is overwhelming and irrelevant, because the policy was never about growth. It was about preservation.
The race to the bottom has been comprehensive. Corporate tax rates have fallen worldwide since 1980, with benefits flowing primarily to wealthy shareholders. Inheritance taxes have fallen across rich countries, and nearly half of the world’s billionaires live in countries with no inheritance tax on wealth passed to direct descendants. According to Gabriel Zucman’s research for the G20, many ultrawealthy individuals now face effective tax rates approaching zero. Meanwhile, the ultrawealthy can pass on what Oxfam has called a “$5 trillion tax-free treasure chest” to the next generation, more than the GDP of Africa. In 2023, for the first time, more new billionaires got rich through inheritance than through entrepreneurship. The next three decades will see over 1,000 of today’s billionaires transfer more than $5.2 trillion to their heirs.
The Offshore System as Class Architecture
When Part 1 described how the top 1%’s share of national income fell from 24% in 1928 to 9% by the late 1970s, and then climbed back, the offshore system was the reservoir into which the restored wealth was channelled. When the tax code was redesigned to favour capital over labour, the offshore system ensured that even the reduced taxes on capital could be further minimised or eliminated. When crises created buying opportunities for the wealthy, the offshore system provided the liquidity and the opacity to execute at scale.
The Tax Justice Network’s estimate of $21 to $32 trillion sitting offshore in private financial assets does not include real estate ($5 to $10 trillion internationally), private art collections, precious metals, private equity holdings, or cryptocurrency. It is a floor, not a ceiling. A 2012 analysis estimated that just 92,000 people, roughly 0.0001% of the world’s population, own approximately $9.8 trillion of the offshore total. The system serves an almost invisibly small number of individuals, at a cost borne by everyone else.
The self-made myth persists because it serves the interests of those who benefit from the architecture. But the data tells a different story: most extreme wealth is not created. It is extracted, inherited, or accumulated through market dominance that would, in an earlier era, have been broken up as anti-competitive.
As Gabriel Zucman investigated for the G20, the wealth of the richest 0.0001% of households, roughly 3,000 families worldwide, went from 3% of world GDP in 1987 to 13% by 2024. Their collective wealth now stands at $14 trillion. A four-fold increase in 35 years, during a period in which the bottom half of humanity saw negligible gains.
The Oxfam report showed that billionaires are 4,000 times more likely to hold political office than ordinary citizens. They own more than half the world’s largest media companies and all the main social media platforms. They fund the think tanks that produce the policy papers. They sit on the boards that appoint the regulators. And when they want the rules changed, they spend $746 million a year making it happen, because the return is $130 for every dollar, plus $4,000 in government-backed support.
The invisible architecture is the foundation on which the visible one rests. And it is the reason the money described in the tier system does not flow back down. It was never supposed to. The system is working exactly as designed.
Next we will look at the specific institutional mechanisms, from private banks to dynasty trusts, that keep the money at the top once it arrives there.
Sources: ICIJ Panama Papers investigation (2016) and nine-year recovery tally ($1.86B as of April 2025); Tax Justice Network “State of Tax Justice 2024” ($492B annual losses, $21-32T offshore estimate), “State of Tax Justice 2025” ($1.7T cumulative corporate losses), and “The Price of Offshore Revisited” (2012, 92,000 individuals / $9.8T); Oxfam “Multilateralism in an Era of Global Oligarchy” (September 2024, lobbying ROI, colonial origins of tax havens, corporate tax trends); Oxfam “Resisting the Rule of the Rich” (January 2026); Gabriel Zucman, “A Blueprint for a Coordinated Minimum Effective Taxation Standard” (G20, 2024); Hope & Limberg, “The Economic Consequences of Major Tax Cuts for the Rich,” Socio-Economic Review (2022); Vanessa Ogle, “Funk Money: The End of Empires, The Expansion of Tax Havens” (2020); Daphne Caruana Galizia assassination reporting via ICIJ, The Guardian, and Maltese public inquiry (2021).
So far, this piece has mapped two things: where people sit in the wealth distribution, and where the money goes once it crosses into the upper tiers. Here we look at why it stays there.
The persistence of extreme wealth is not a natural outcome of talent or effort, rather it is maintained by a set of institutional mechanisms that function as a scaffolding around accumulated capital, preventing it from dispersing, eroding, or being subject to the same forces that govern wealth at lower tiers. These mechanisms include private banking, legal architecture, corporate concentration, passive investment structures, and a tax code that treats ownership as more valuable than labour. Together, they ensure that wealth above a certain threshold becomes self-sustaining, and that the people who hold it are functionally insulated from the economic forces that shape life for everyone else.
The institutions that protect concentrated capital select loyalty over competence, increasingly have priorities that are disconnected from the health of the economy it claims to be leading.
The Meritocracy Problem
The story is meritocracy: the wealthy are wealthy because they are talented, disciplined, and innovative. They created value. They earned it. The system rewarded them fairly.
The data does not support this.
Oxfam’s 2025 “Takers Not Makers” report found that approximately 60% of global billionaire wealth is unearned. The breakdown: 36% derives from inheritance, 18% from monopoly power, and 6% from crony connections or corruption. Every billionaire under 30 inherited their fortune. In 2023, for the first time, more new billionaires got rich through inheritance than through entrepreneurship. Over the next three decades, more than 1,000 of today’s billionaires will transfer an estimated $5.2 trillion to their heirs.
It is a wealth-preserving system that occasionally generates wealth as a byproduct.
The distinction matters because policy is built on the meritocratic premise. Tax cuts for the wealthy are justified by the claim that these are the people who create value, and taxing them less will produce more value for everyone. The 50-year empirical record shows this to be false. But the premise persists because the people it benefits are the same people funding the institutions that repeat it.
Table 4: How Billionaires Got Rich
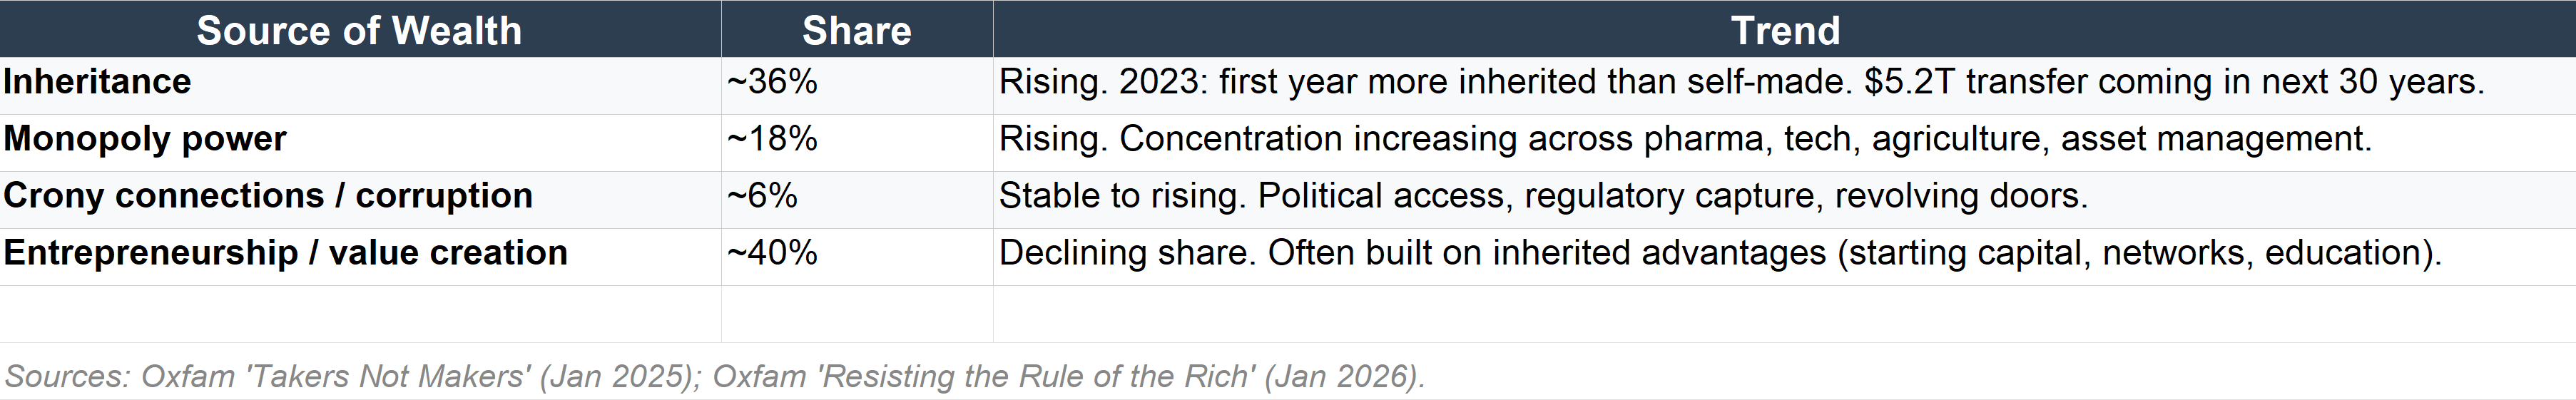
Source: Oxfam, “Takers Not Makers” (January 2025); Oxfam, “Resisting the Rule of the Rich” (January 2026). Note: Oxfam’s analysis defines monopoly power as wealth derived from dominant market positions with limited competition; crony connections include wealth derived from proximity to political power or from corruption.
Many of the so-called ‘self-made’ millionaires and billionaires benefited from starting capital, social networks, educational access, and generational wealth that provided platforms from which to launch their ventures. Inheritance includes early access to elite education without debt, seed capital for ventures, social networks that open doors to careers and deals, and embedded legal and financial knowledge within family structures. These advantages compound over time through what economists call path dependency: once on a trajectory of accumulation, it becomes easier to remain on that path, especially when the systems surrounding it are designed to minimise friction for those already on it.
The Corporate Concentration Engine
The institutional scaffolding operates through the corporate structures that billionaires own and control.
The Oxfam briefing paper on global oligarchy revealed a level of corporate concentration that has no precedent in the post-war era. Sixty pharmaceutical companies merged into just ten large corporations between 1995 and 2015. Two firms now control 40% of the global seed market. Nearly 75% of global digital advertising revenue flows to just three technology companies. The “Big Three” US asset managers, BlackRock, State Street, and Vanguard, collectively manage approximately $20 trillion in assets, nearly 20% of all assets under management worldwide.
The profit concentration is even starker. In the United States between 2019 and 2022, among non-financial public corporations, the top 10% of firms earned 95% of all post-tax profits. Globally, between 1975 and 2019, the share of multinational corporate profits in overall corporate profits quadrupled from 4% to 18%.
Table 5: Corporate Concentration Across Sectors
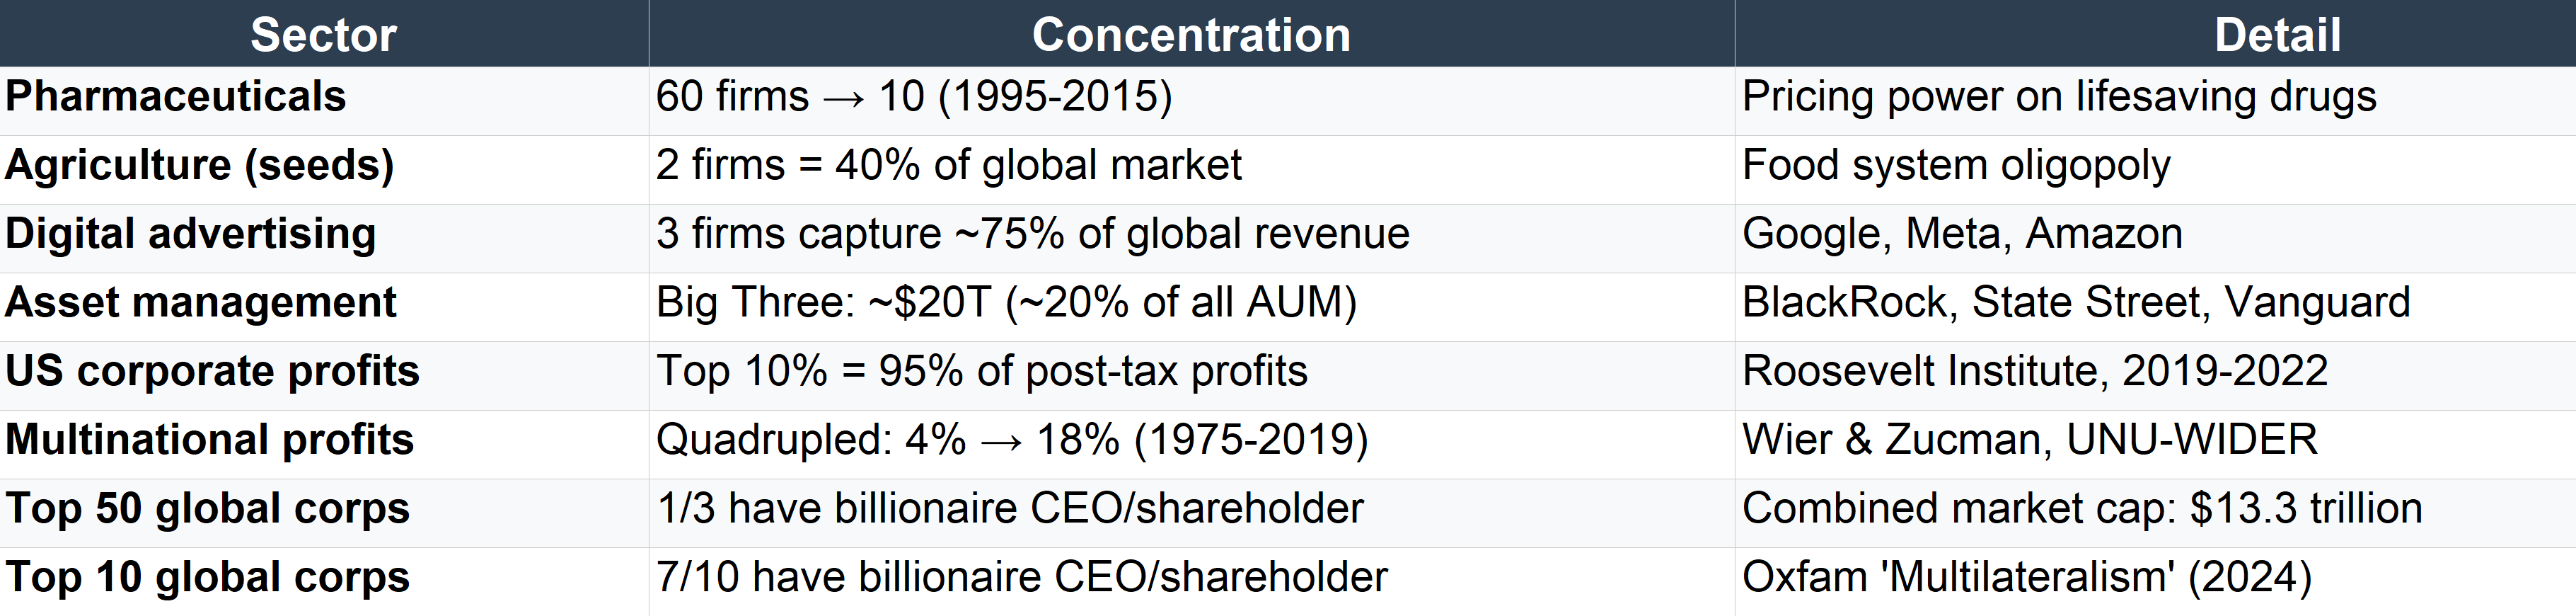
Sources: Oxfam “Multilateralism in an Era of Global Oligarchy” (September 2024); Pang et al., European Commission (pharma mergers); ETC Group “Food Barons” (seed market); Roosevelt Institute / Hager & Baines (US profit concentration); Wier & Zucman, UNU-WIDER (multinational profit share).
This matters for the scaffolding argument because concentrated corporate power and concentrated personal wealth are not separate phenomena. They are the same phenomenon viewed from different angles. The top 1% of the global population owns 43% of all financial assets. The top 0.1% of US households own nearly a quarter of all corporate equities and mutual fund shares. The bottom half owns 1%. Billionaires are either the CEO or principal shareholder of roughly one-third of the world’s 50 largest public corporations. Of the ten largest, seven have a billionaire at the helm or as a principal shareholder.
When a handful of firms dominate their sectors, the profits flow to shareholders. The shareholders are concentrated at the top of the wealth distribution. The profits fund the lobbying that protects the market dominance. The lobbying produces the regulatory outcomes that prevent competition. The cycle is closed.
Oxfam describes this precisely: “The concentration of wealth and corporate power are not natural results of a ‘free market’ but are, to a large degree, consequences of economic planning by and for the ultrarich.” Neoliberal changes in corporate governance have led to the maximisation of shareholder value being prioritised over all else. Since the ultrawealthy own a disproportionate share of equities, corporations effectively act on behalf of the richest in society. This is not a conspiracy theory, instead the stated legal obligation of a publicly traded corporation: maximise shareholder returns.
The Private Infrastructure of Permanence
Below Tier 5, if you earn $50,000 a year and lose your job, you have unemployment insurance (if you qualify), whatever savings you have (the median American has less than $1,000 in savings accessible within a day), and the goodwill of people who are probably in a similar position. If your rent goes up, you move or you fall behind. If you get sick, you either have insurance through your employer (which you just lost) or you don’t. There is no private bank managing your downside. There is no legal team restructuring your obligations. There is no dynasty trust protecting your children’s inheritance, because there is no inheritance.
Above Tier 5, the infrastructure is comprehensive.
Private banks offer products that do not exist at lower tiers. Bespoke lending facilities allow the wealthy to borrow against appreciated assets at rates that Tier 2 households could never access, generating liquidity without triggering taxable events. Tax-optimised debt structures turn borrowing into a wealth-preservation tool. Alternative asset access, hedge fund participation, and private equity deals are restricted to accredited investors, which in practice means restricted to people who are already wealthy.
Legal teams skilled in asset protection, trust creation, and jurisdictional arbitrage provide a layer of insulation that has no equivalent below the threshold. Dynasty trusts can hold assets in perpetuity across generations, shielded from estate taxes, creditors, and legal judgments. There are over 10,000 family offices worldwide managing an estimated $5.5 trillion with almost no regulatory oversight. Charitable foundations function as both reputational laundering and wealth-preservation vehicles, allowing tax deductions on donated assets while maintaining functional control through board appointments and grant decisions.
The proximity to power that wealth provides is itself a mechanism. Insider access to capital flows, political decision-making, and regulatory timing means that the wealthy are passive beneficiaries and architects of the system. When crises are managed, the people managing them are often drawn from the same networks, firms, and social circles as the people whose wealth is at stake. Lobbying power allows wealth holders to shape the conditions under which crises are resolved. Part 1 documented how the 2008 crisis was resolved in ways that protected asset holders while millions lost their homes.
The Passive Index Trap
There is one more piece of the scaffolding that receives too little attention: the structural mechanics of passive index investing.
As explained in The Number Is Going Up, the ten largest companies now account for approximately 38-41% of the S&P 500’s total market capitalisation. The Big Three asset managers (BlackRock, State Street, Vanguard) collectively hold significant ownership stakes in virtually all of them. When a pension fund or 401(k) invests in an S&P 500 index fund, it is mechanically directing capital toward the companies that are already the largest, in proportion to their existing size. The bigger a company gets, the more capital flows to it. The more capital flows to it, the bigger it gets.
This is a mathematical function that compounds concentration. And because the top 10% of households own approximately 93% of stocks, the appreciation driven by passive inflows disproportionately enriches those who are already at the top. The S&P 500 does not measure the health of the economy, but rather increasingly measures the wealth of the people who own it.
In summary, it works like this: concentrated corporate power generates concentrated profits. Concentrated profits flow to concentrated shareholders. Concentrated shareholders fund the lobbying that protects the concentration. The tax code rewards ownership over labour. The legal framework prevents erosion through inheritance taxes, estate taxes, or market forces. The passive index system mechanically amplifies whatever concentration already exists. And the offshore system provides the final layer of protection: moving wealth beyond the reach of any single government’s jurisdiction.
Each mechanism individually might be defensible. Together, they constitute a permanence that has no historical parallel in its scale, sophistication, or global reach.
This mechanism can be further leveraged by the tech that wealth owns.
What concerns me most about the current trajectory is the prospect that frontier AI labs may eventually ban or heavily restrict the use of AI tools to develop or research AI systems themselves. A classic ladder-up-behind scenario.
This would massively accelerate cognitive inequality, which is particularly bitter considering that labs likely owe the vast majority of their models’ capabilities to publicly available data, much of it scraped without explicit consent, and further refined through public interaction. The reality looks closer to labs acting as service providers of system architecture and systems administration, housing systems that generate information from data that was originally public, then further trained through public interaction. Have corporations already taken on the role of gatekeeping shared human knowledge without anyone’s consent? Where should they be allowed to draw the line?
The Two Systems

GEORGINA
Oh no, no, no, no, no, no...
[…] That’s not my experience. Not at all.
The Armitages are so good to us;
They treat us like family.
There are two financial systems operating simultaneously.
One governs Tiers 1 through 4: debt is extractive, risk is personal, losses are permanent, and the tax code treats your income as the most taxable form of wealth. The other governs Tiers 6 and 7: debt is strategic, risk is diversified, losses are negotiated, and the tax code treats your assets as essentially untouchable.
The people in the first system are told the second system doesn’t exist, or that it exists because the people in it earned their way there through merit. The data says otherwise. Sixty percent of billionaire wealth is unearned. The top 10% of firms take 95% of profits. The tax code is the creator of the aristocracy. And the scaffolding is designed to ensure that once wealth crosses the threshold, it never comes back down.
Sources: Oxfam “Takers Not Makers” (January 2025, 60% unearned data, inheritance trends, $5.2T transfer); Oxfam “Multilateralism in an Era of Global Oligarchy” (September 2024, corporate concentration data, Big Three, profit concentration, political capture analysis); Oxfam “Resisting the Rule of the Rich” (January 2026, billionaire political office, media ownership); Roosevelt Institute / Hager & Baines (US profit concentration); Wier & Zucman, UNU-WIDER (multinational profit share); Federal Reserve Distributional Financial Accounts Q3 2025 (wealth by percentile, equity ownership); ETC Group “Food Barons 2022” (seed market); European Commission / Pang et al. (pharma mergers); Gabriel Zucman, G20 blueprint (effective tax rates).
Trillions of dollars in shell companies registered in the British Virgin Islands. Dynasty trusts structured across generations. Passive index mechanics compounding concentration through mathematical inevitability. These are real forces shaping real outcomes, but for most people they operate at a distance, in jurisdictions they’ve never visited, through instruments they’ve never heard of.
Housing is where the abstract arrives on your doorstep.
In 1985, a median American home cost roughly 3.5 times the median household income. By 2024, that ratio had climbed to five. In San Jose it’s over twelve. In Los Angeles it’s over ten. Nationally, households now need to earn approximately $107,000 a year to afford a median-priced home at current mortgage rates. The median household income is $83,000. The maths does not work, and it has not worked for a growing share of the population for over a decade.
Between 2019 and 2024, median home prices rose 48%. Median incomes rose 22%. That gap did not close. It widened. And unlike stock market fluctuations or offshore wealth estimates, this gap is felt every single month when the rent or mortgage payment comes due. It determines where your children go to school, how far you commute, whether you can save anything at all, and whether a job loss means inconvenience or catastrophe.
Part 1 of this series described how Blackstone, through its subsidiary Invitation Homes, purchased roughly 50,000 foreclosed single-family homes in the wake of the 2008 financial crisis, converting owner-occupied housing into permanent rental stock and taking the company public in 2017. That transaction embodied the crisis consolidation playbook: distressed assets acquired at discount by capital with liquidity, converted into income-generating instruments, and never returned to the market from which they were extracted. The homes that American families lost in the crash became the rental portfolio from which a private equity firm now collects monthly payments.
Part 2 described how RealPage, an algorithmic pricing platform used by major landlords managing millions of units, enabled what the Department of Justice has alleged amounts to collective rent-fixing. The algorithm recommends prices across competing landlords using shared data, producing a coordination mechanism that achieves the effect of price collusion without requiring anyone to pick up the phone. The result: rents that rise faster than they would in a competitive market, across properties managed by companies that are supposedly competing with each other.
The $18.8 Trillion Problem unpacks the consumer debt dimension. At the top, homeowners with equity are tapping HELOCs (home equity lines of credit) at historically high rates, 15 consecutive quarters of growth reaching $433 billion outstanding, borrowing against appreciated assets at favourable rates. This is the leverage loop from Part 1, operating at the household level: borrow against what you own, deploy the liquidity, let the asset continue to appreciate. At the bottom, credit card debt has hit $1.28 trillion at average interest rates above 20%, with delinquency rates climbing to 4.8%. Student loan delinquency sits at 9.6%. The same financial system that offers the wealthy cheap leverage against appreciating assets offers the rest expensive debt against depreciating income.
Housing is the clearest illustration of Piketty’s r > g in everyday life. When the return on capital (r) exceeds the rate of economic growth (g), the people who already own assets pull away from those who don’t. In housing, this plays out with brutal simplicity: if you bought a home before 2020, your equity has likely grown by 40-60%. If you didn’t, you are now priced out of markets where your parents bought comfortably. The asset appreciated. The wage didn’t.
The generational dimension compounds this. Baby boomers hold an estimated $30 trillion or more in housing wealth. Many bought homes when the price-to-income ratio was 3 or 4, with mortgage rates that, while nominally higher, applied to dramatically lower principal amounts. Their housing wealth has appreciated enormously, but this appreciation has not transferred downward. Instead, it has created a generational lock-out: younger households face higher prices, higher rates (6.8% on a 30-year fixed as of 2025, applied to a $417,000 median), and the requirement to earn $107,000 a year for a purchase that their parents made on $40,000.
This is the tier system made concrete. Tiers 1 and 2 rent, paying 40-50% or more of their income for housing they will never own. Tier 3 is locked out of ownership entirely in most major metros, or takes on debt that leaves no margin for error. Tier 4 owns, but overleveraged, one downturn from negative equity. Tier 5 owns multiple properties and uses them as collateral. Tiers 6 and 7 hold real estate portfolios managed by family offices, and when they want to add to them, they buy the foreclosures from the tiers below.
The offshore estimates excluded international real estate, which the Tax Justice Network estimates at $5 to $10 trillion. Some of the world’s most expensive residential property in London, New York, Vancouver, and Sydney is held through offshore shell companies, purchased as wealth-storage vehicles rather than homes. They sit empty. The lights don’t come on. The local housing market counts them as supply, but they are functionally withdrawn from it. This is the invisible architecture made visible: a penthouse in Kensington purchased through a BVI entity, owned by a trust in Jersey, benefiting a family in Tier 7, and contributing to the housing crisis experienced by everyone in Tiers 1 through 4 who lives within a hundred miles of it.
Housing is the primary interface between the financial system and ordinary life. It is where the offshore meets the on-shore. Where the leverage loop meets the rent cheque. Where the generational transfer of wealth meets the generational lock-out of everyone else.
And housing is only the most visible example. The same dynamic is playing out in energy costs, quietly redistributing the burden of the AI boom onto the people least able to bear it.
In Ohio, which now hosts approximately 200 data centres (120 in the Columbus area alone), residential electricity rates have spiked. A single data centre uses as much power as thousands of homes. State law does not allow the utility to build new power plants quickly enough to keep up, so it raises rates on regular people to cover the infrastructure. One household reported paying $542 more in a single year, $506 of it attributable to energy cost increases. The AI boom is being subsidised, in part, by the electricity bills of the people it is displacing.
When the primary store of middle-class wealth becomes inaccessible, when the cost of basic utilities rises to fund an industry whose benefits accrue almost entirely to the top, the downstream effects show up not just in household budgets but in how money moves through the entire economy. Next we examine that movement, and explain why GDP can rise while the economy most people actually live in hollows out.
If the economy is growing, if GDP is rising, if the stock market is at all-time highs, why does it feel like things are getting worse for most people?
The Heartbeat
The velocity of money measures how quickly a dollar circulates through the economy. When you earn a dollar and spend it at a shop, the shopkeeper pays their supplier, the supplier pays their workers, those workers spend their wages, and each transaction generates economic activity. The faster money moves, the more economic life it generates per dollar in existence. Velocity is the heartbeat of an economy. When it slows, the body starts to fail even if the blood supply looks adequate on paper.
M2 velocity, the standard measure, peaked at 2.19 in 1997. As of Q4 2025, it sits at 1.409. That is a 36% decline over 28 years. For every dollar circulating through the American economy in 1997, roughly $0.64 worth of circulation is happening now. The money supply has grown enormously. The economy has grown. But the rate at which money actually moves through the system, reaching people, generating transactions, sustaining businesses, has fallen to near-historic lows.
Post-2008, velocity averaged around 1.4, compared with 1.9 pre-crisis. It briefly touched 1.13 during the pandemic shock of April 2020, the lowest ever recorded. It has recovered only marginally since. As the economist Daniel Lacalle has observed, when 4.5% money supply growth produces only 2.5% real GDP growth, the economy is demonstrating that additional money is not generating a multiplier effect. The money exists. It is just not moving.
This is the tier system expressed as a macroeconomic phenomenon.
Where the Money Pools
Early on we mapped seven tiers of wealth. The velocity problem is what happens when you look at those tiers from the perspective of money flow rather than money stock.
The wealthy can only consume so much. A household earning $30 million a year does not spend three hundred times as much on groceries as a household earning $100,000. They don’t buy three hundred times as many haircuts, or fill their car with petrol three hundred times as often. Their marginal propensity to consume, the share of each additional dollar that goes to spending rather than saving, is dramatically lower than that of a middle-income household. If you give a Tier 2 household an extra thousand dollars, most of it will be spent within weeks: on rent, food, bills, deferred car repairs. If you give a Tier 7 household an extra thousand dollars, it is economically irrelevant to them. It gets absorbed into a portfolio, parked in an asset, or routed through structures described earlier.
When income and wealth concentrate at the top, the share of total money that is actively circulating through the consumer economy declines. Consumer spending drives roughly 70% of US GDP. The top 10% of households now account for over half of all consumer spending. But even the top 10% cannot replace the aggregate demand of the remaining 90%, because spending patterns at the top are oriented toward assets, not goods and services. The excess capital flows into real estate, equities, private equity, art, collectibles, and offshore structures. It bids up prices on assets without generating the transactions that sustain businesses, wages, and employment at the tiers where most people live.
This creates a feedback loop. Concentrated wealth drives asset inflation, which raises prices (particularly housing and financial assets) for everyone. Rising prices reduce the purchasing power of wages at the bottom, further reducing their capacity to spend, which further slows velocity, which further concentrates returns at the top. The economy reported in aggregate looks healthy because asset values are rising and capital investment is being counted. The economy experienced by most people feels increasingly precarious because the money that is supposed to sustain demand at their tier has been redirected upward.
The wealth effect that drives the spending numbers is concentrated in a population that is already spending. The tiers below, where the spending would matter most for velocity, see almost none of it.
Ghost GDP
We have already shown how AI-related capital expenditure accounted for between 20% and 90% of US GDP growth in the first half of 2025, depending on the methodology used. Strip out AI capex, and the American economy was barely growing. This is an extraordinary dependency: the headline growth figure for the world’s largest economy is being sustained by a single sector’s infrastructure spending, financed in significant part by circular investment structures between a handful of companies.
Michael Spencer’s concept of “Ghost GDP” captures what this means for velocity. GDP measures the total value of goods and services produced. It counts capital investment: when Microsoft spends $80 billion on data centres, that registers as economic activity. But the money flows from Microsoft to Nvidia (chips), to construction firms (buildings), to power companies (electricity). It does not flow to the households in Tiers 1 through 4 whose spending drives the consumer economy. The GDP number goes up. The velocity of money through the real economy does not.
There is a further structural problem. GDP measures *change* in spending, not level. If Big Tech spent $427 billion on capex in 2025 and spends $650 billion in 2026, the $223 billion increase contributes to GDP growth. But if spending plateaus at $650 billion in 2027, the contribution to growth drops to zero, even though the spending level remains enormous. The AI sector has to keep accelerating just to maintain its contribution. This resembles a treadmill more than a foundation. And the treadmill is being run by a sector that employs relatively few people, whose supply chain is largely international (Nvidia GPUs manufactured in Taiwan), and whose productivity gains, if they materialise, will reduce employment rather than increase it.
Michael Burry, who correctly identified the subprime mortgage crisis before anyone else, put it bluntly in a recent post: “No one will pay for the singularity. There is no end-economic demand for it. AIs spinning up a knowledge spiral is a human nightmare, not a human demand.”
The AI companies are building toward a capability that their prospective customers do not want, cannot afford, or will not survive. Compression of models toward edge devices, Burry argues, will make the current infrastructure investment look like a miscalculation of historic proportions. The treadmill does not lead to a destination. It leads to the next turn of the treadmill.
And beneath the macroeconomic abstraction lies something more human. During the industrial revolution, beyond the obvious practical devastation of worker displacement, there was a lesser-discussed and possibly more brutal crisis of meaning. Many people had their identities inseparably tied to their craft and their work. Then, almost overnight, both were gone. The identities and the crafts. We are arguably in a similar position now. AI automates judgment, prediction, and decision-making: the capacities that used to provide human workers with irreplaceable value. When those capacities are commoditised, the displacement is not only economic, but existential too. And an economy that cannot account for existential displacement in its models will not see the crisis coming until demand collapses and the velocity chart tells the story retrospectively.
The demand paradox from the second part of this series resurfaces here. If AI delivers on its promise, it automates the jobs that generate the wages that power the consumer spending that constitutes 70% of GDP. If it doesn’t deliver, the hundreds of billions in speculative investment collapse. Either way, velocity takes the hit. The question is whether it comes as a slow decline or a sudden one. As kyla scanlon observed recently, we have a society-wide gambling problem.
[“Everyone is Gambling” - YouTube]
We are chasing losses into oblivion. And the everyday person is not getting much of a say.
The Velocity Table
Table 6: M2 Velocity and Wealth Concentration (Selected Years)
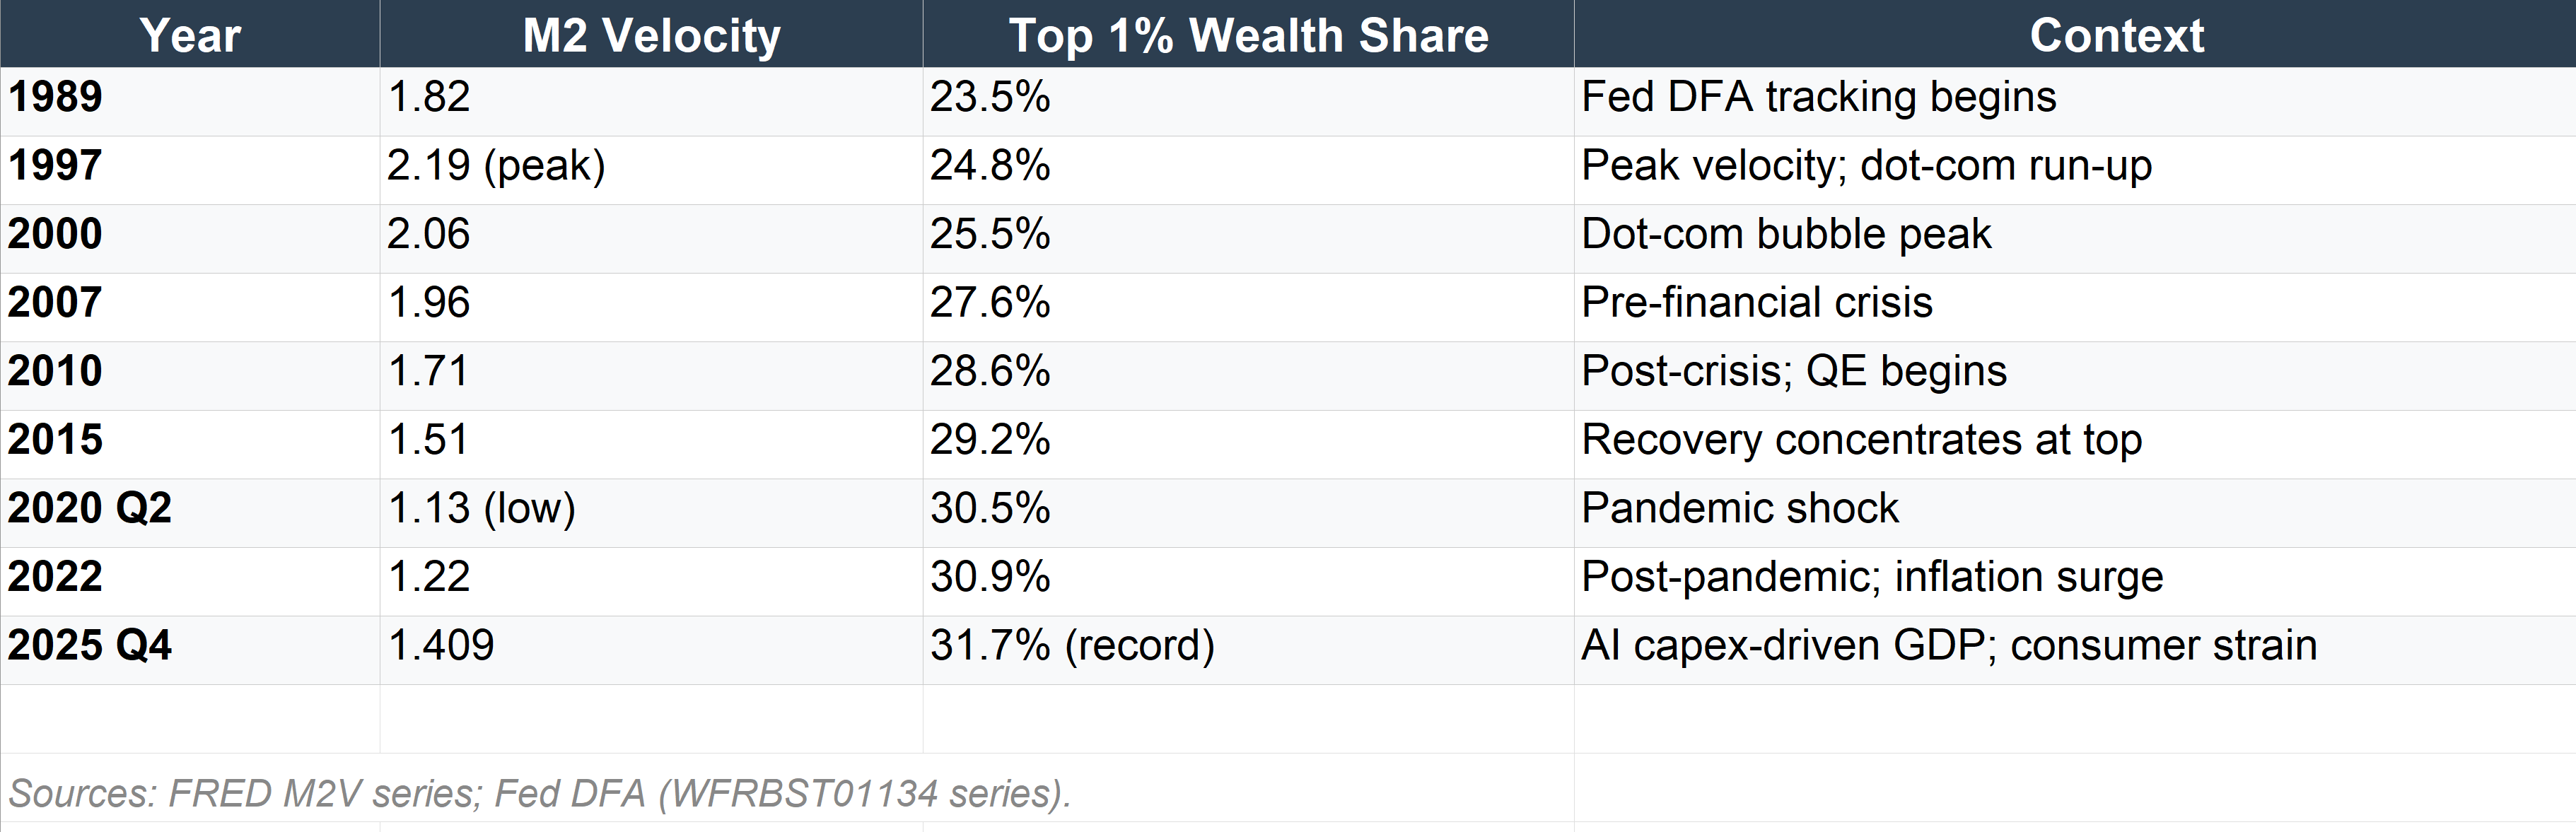
Sources: Federal Reserve Bank of St. Louis (FRED M2V series); Federal Reserve Distributional Financial Accounts (WFRBST01134 series). Velocity figures are quarterly or annual averages. Top 1% wealth share is as reported in DFA releases.
The table tells a clear story. As wealth concentrates, velocity declines. The relationship is not perfectly linear, and there are other factors (monetary policy, financial innovation, globalisation), but the directional pattern over 36 years is unmistakable. The top 1%’s share of wealth rose from 23.5% to 31.7%. Velocity fell from 1.82 to 1.41. More wealth at the top. Less movement through the system. The numbers go up. The economy, for most people, does not.
Hank Green, in a conversation referenced in Part 1, put it simply: “The economy can look fine in aggregate when normal people are not feeling fine.” The velocity data shows why. The money is there. It is just not where it needs to be for the economy to function as most people experience it. It sits in the tiers, structures, and jurisdictions described in the preceding sections. And as long as it stays there, the headline numbers will continue to diverge from lived reality.
Next we look at how this dynamic is not just confined to the United States. It operates globally, and its consequences are measured not just in stagnant wages and unaffordable housing, but in debt traps, preventable deaths, and geopolitical violence.
The same mechanisms that extract value from Tiers 1 through 4 within the United States extract value from the Global South on a continental scale. The same institutions that protect wealth at the top of the domestic tier system protect it at the top of the international one. The same offshore jurisdictions that hide American billionaire wealth hide the stolen assets of former colonial administrators, kleptocratic presidents, and multinational corporations shifting profits out of the countries where they were generated.
The domestic tier system and the international tier system are the same architecture, viewed at different scales. The pooling that slows velocity within the United States operates identically at the global level: wealth flows from the periphery to the centre, from the Global South to the Global North, from the many to the few, and then it stops moving.
The Global Tier System
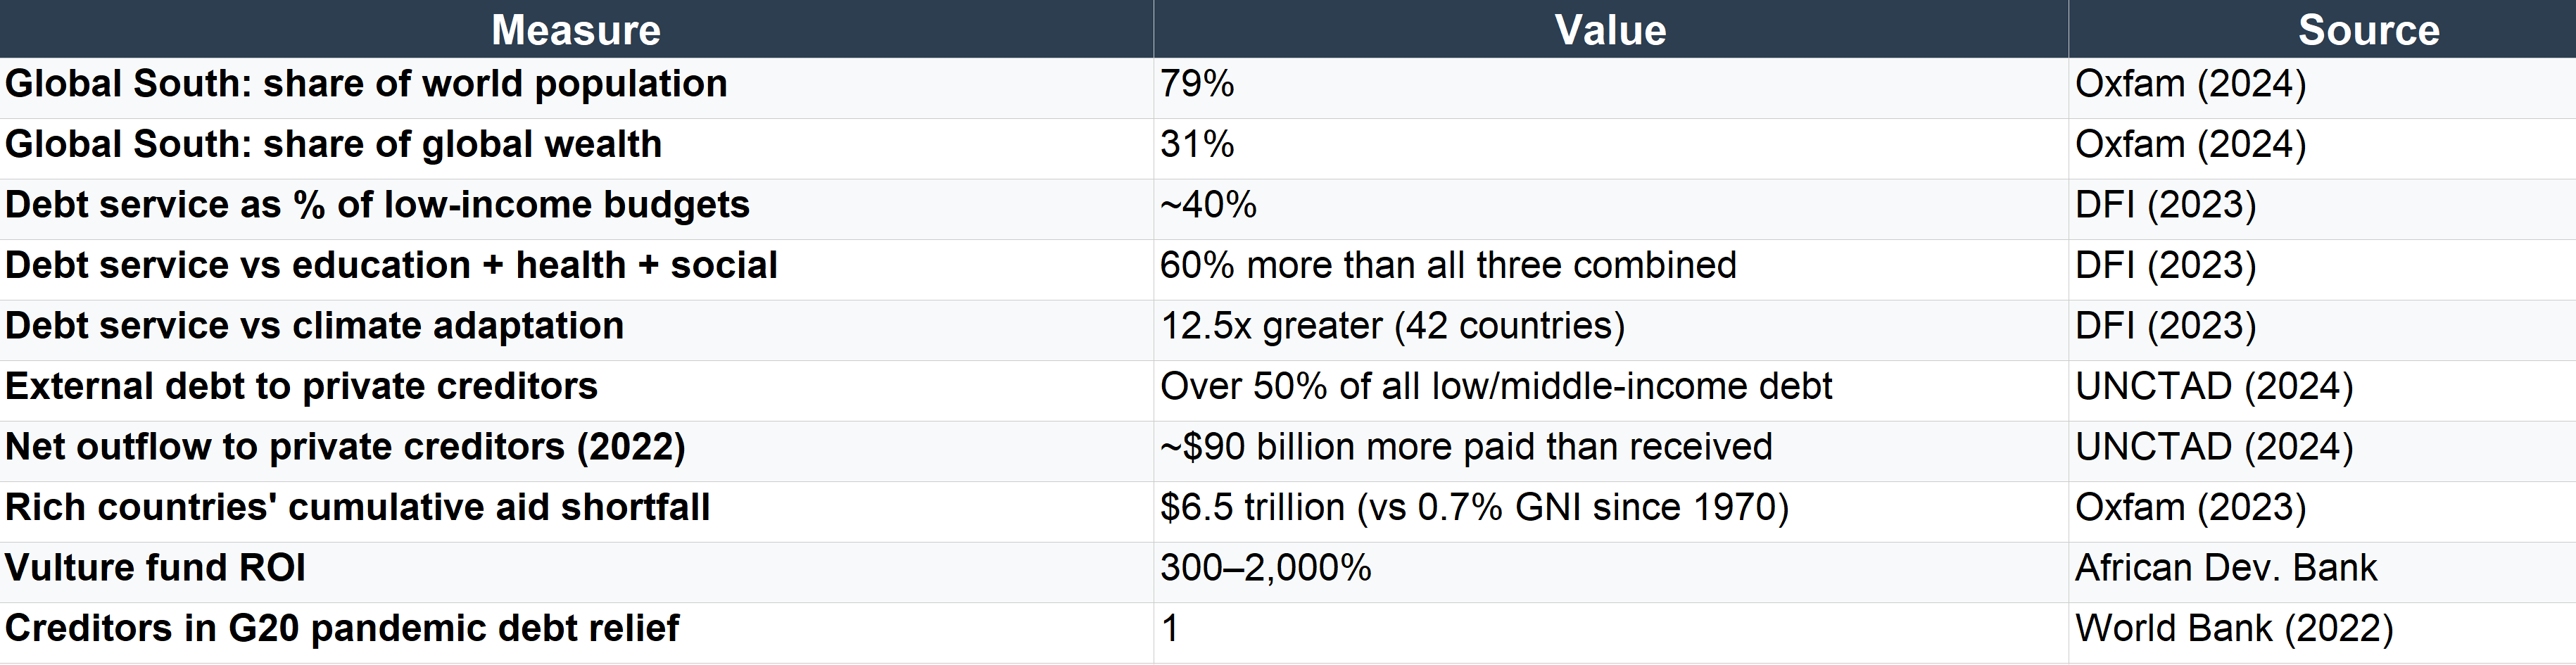
The Oxfam briefing paper on global oligarchy laid out the international wealth distribution in terms that mirror the domestic tiers. The Global South, home to 79% of the world’s population, holds just 31% of global wealth. Nearly half the world’s population, over three billion people, live on less than $6.85 a day. Meanwhile, the top 1% own more than the bottom 95% of humanity, and the twelve richest billionaires now hold more wealth than the poorest four billion people combined.
Global South countries as a whole transfer more financial resources to foreign capital in rich countries than they receive. This is not a new pattern. It dates to the colonial era, when the economy was first constructed to extract resources, labour, and wealth from colonised territories and channel them to European metropolitan centres. What has changed is the mechanism. Where colonial extraction once operated through direct political control, it now operates through debt, intellectual property, tax arbitrage, and offshore systems. The Oxfam report is explicit: many of the world’s secrecy jurisdictions were originally constructed by Northern bankers, lawyers, and consultants to allow British and French settlers in the Caribbean and across Africa to shield their wealth from decolonisation. The same jurisdictions now shield corporate profits from taxation in the countries where they are generated.
The Debt Trap
The most visible mechanism of global extraction is debt.
Low-income countries now spend nearly 40% of their annual budgets on debt service. That is over 60% more than they spend on education, health, and social protection combined. In 42 Global South countries analysed by the Development Finance International, debt service spending in 2023 was on average 12.5 times greater than climate adaptation spending. Countries are paying more to service past debts than they are investing in surviving the climate crisis that the richest countries disproportionately caused.
Over half of all external debt in low- and middle-income countries is now owed to private creditors: banks, hedge funds, and institutional investors. This matters because private creditors charge higher, more volatile interest rates than governments or multilateral lenders, and they have systematically refused to participate in debt relief efforts. During the Covid-19 pandemic, the G20 launched a Debt Service Suspension Initiative. According to the World Bank, just one private creditor participated. The rest argued that participation would reduce profits and violate their fiduciary duty to investors. Private credit rating agencies even threatened to downgrade countries that accepted the relief.
In 2022, Global South countries paid their external private creditors nearly $90 billion more than they received in new disbursements. Money flowing from poor countries to rich investors, during a period of overlapping crises (pandemic, climate, inflation, conflict). Since 1970, when the UN General Assembly called for rich countries to provide at least 0.7% of their gross national income in development aid, wealthy nations have underpaid by a cumulative $6.5 trillion.
Some private creditors have built business models around this. “Vulture funds” purchase distressed sovereign debt at steep discounts and exploit legal mechanisms to demand repayment at full face value, generating returns of between 300% and 2,000%. The profits are extracted from countries that are already unable to fund their schools and hospitals. They are extracted at the expense of other creditors who have agreed to restructure. And they are extracted by a handful of extremely wealthy individuals operating from financial centres in New York and London.
Table 7: The Global South Debt Trap
Sources: Oxfam “Multilateralism in an Era of Global Oligarchy” (September 2024); UNCTAD “A World of Debt Report 2024”; Development Finance International (October and November 2023); African Development Bank; World Bank DSSI briefing (2022).
Vaccine Apartheid
The Covid-19 pandemic provided the most concentrated demonstration of how the global wealth architecture converts public crisis into private profit.
The seven largest vaccine producers generated $50 billion in net profit from Covid-19 vaccine sales in 2021 alone. Pfizer paid $8.7 billion in shareholder dividends that year. The pandemic created at least 40 new billionaires, individuals who amassed fortunes from ownership of companies involved in vaccines, tests, and treatments. Meanwhile, public bodies had funded between 33% and 67% of the upfront research and development costs for the vaccines. The public paid for the research. Then the public paid for the product. The profits went to shareholders.
When South Africa and India proposed a temporary waiver of TRIPS intellectual property protections to allow wider vaccine manufacturing, the pharmaceutical industry mobilised aggressively. Drug corporations spent over $360 million lobbying in the United States and €15 million in the EU in 2021. According to an investigation by Politico and the Bureau of Investigative Journalism, corporations threatened to withdraw investment from countries that supported the waiver, including Indonesia and Belgium. The CEO of Pfizer, Albert Bourla, described the call to share vaccine technologies as “dangerous nonsense.”
The waiver that was eventually agreed, in June 2022, was so limited and so late that worldwide vaccine demand had already fallen sharply. It did not cover treatments, diagnostics, or the manufacturing expertise needed to scale production. It was, in practical terms, a victory for the pharmaceutical lobby.
The human cost: according to a study published in Nature Medicine, more equitably sharing vaccines would have reduced global Covid-19 mortality by 13.3% between 2020 and 2021, preventing as many as 1.3 million deaths worldwide, with a 39% decrease in low-income countries. A separate Lancet study found that 200,000 deaths in low-income countries could have been averted had WHO vaccination targets been met between December 2020 and December 2021.
1.3 million people. For pharmaceutical profit margins.
Climate as Class War
The emissions data completes the picture. The CO2 emissions of the richest 1% exceed those of the poorest two-thirds of humanity, roughly five billion people. In early 2026, Oxfam calculated that the top 1% had blown through their entire annual carbon budget for the year in just ten days. Billionaire investments in polluting industries are double the average for the S&P 500.
At COP26, there were over 500 fossil fuel lobbyists present, more than the combined delegations of eight countries that have been severely impacted by climate change, including Pakistan, Bangladesh, and the Philippines. At COP28, at least a quarter of billionaire delegates had made their fortunes from polluting industries including petrochemicals, mining, and beef production.
The people most responsible for the climate crisis are the same people at the top of the wealth tiers. The people least responsible for it are the ones spending 12.5 times more on debt service than on climate adaptation. The system extracts wealth from the Global South, denies it the resources to adapt, and then charges it for the consequences of a crisis it did not cause.
The War Economy

ROSE
It’s basically a bunch of rich old people playing lawn games.
As this article is being written, the Middle East is fully engulfed in war.
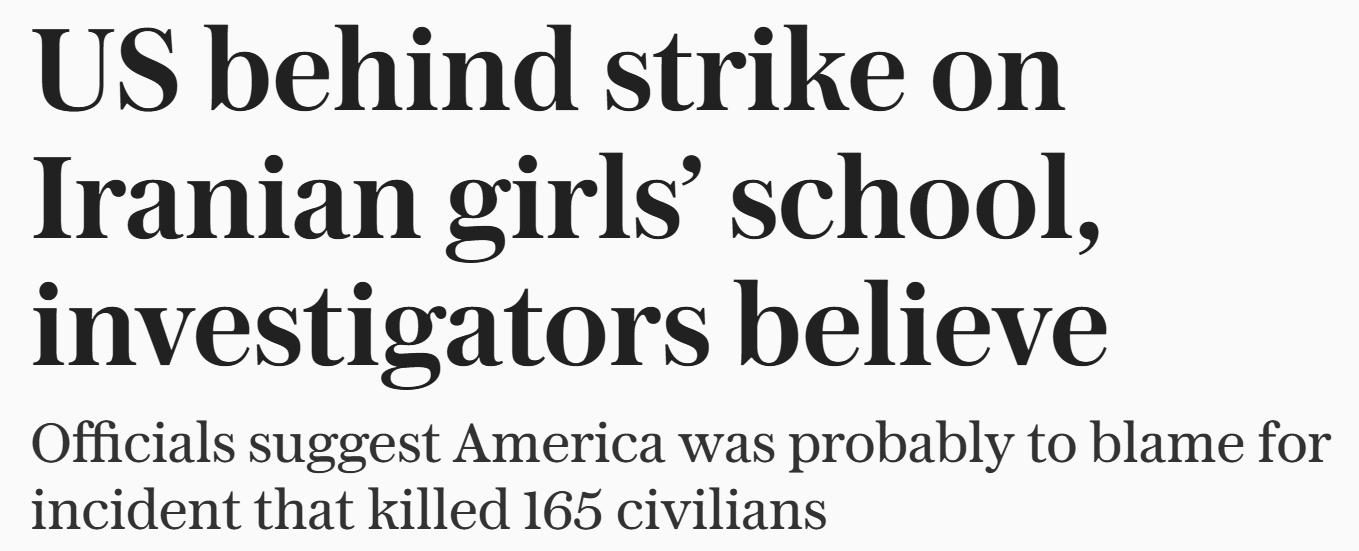
The United States and Israel launched Operation Epic Fury on 28 February 2026, the most significant US military action in the Middle East since the Iraq War. In the first week, over 400 targets were struck inside Iran. Iran’s supreme leader, Ali Khamenei, was killed in the opening strikes. Over 30 Iranian ships have been sunk. The Iranian Red Crescent reported more than a thousand killed by the seventh day.
Iran has retaliated with missile and drone strikes hitting targets in Dubai, Abu Dhabi, Bahrain, Jordan, Kuwait, and Israel, including a strike on the US Navy’s 5th Fleet headquarters in Bahrain, one of America’s most critical military commands in the region.
The Strait of Hormuz has been declared effectively closed to commercial shipping. Gulf oil and gas producers are warning that exports could be cut off within weeks.
Trump has stated that only Iran’s “unconditional surrender” will bring it to an end. Reports have emerged that at least one commander urged troops to tell their units that the operation was “all part of God’s divine plan,” referencing the Book of Revelation and the imminent return of Jesus Christ.
The UN Secretary General has condemned all the violence. Senator Elizabeth Warren left a classified briefing and said she was more worried than before.
The Oman peace breakthrough, in which Iran had agreed to never stockpile enriched uranium and accepted full IAEA verification, was announced one day before the strikes began. Peace was, in the words of Oman’s foreign minister, “within reach.” The strikes proceeded anyway.
During Trump’s current presidential term, the United States has conducted military strikes or major combat operations in seven countries: Iran, Venezuela (including the capture of President Maduro in January 2026), Yemen, Somalia (135 operations in 2025 alone, more than the previous three administrations combined), Syria, Nigeria (the first known US kinetic military action in the country, on Christmas Day 2025), and Iraq.

ROSE
What the fuck was that?
DEAN
It was a seizure.
ROSE
A seizure?
CHRIS
Why did he come at me like that?
DEAN
Seizures can have a wide range of effects.
ROSE
Yeah, but randomly attacking people?
Explicit military threats have been issued against Colombia, Mexico, Greenland, and Cuba. More strikes have been launched in the first year of this term than during the entire four years of the predecessor.
China’s public statement in response noted that in its 240-year history, the United States has been at peace for only 16 years, maintains over 800 military bases in 80 countries, and is “the sole reason for global instability.”
Twenty-eight percent of the world’s countries are currently engaged in serious armed conflict.
The war economy is the geopolitical expression of the same wealth architecture. Defence contractors profit. AI military contracts proliferate. The Pentagon declared Anthropic a “supply chain risk,” the first time in US history that an American company received that designation, because the company refused to permit mass domestic surveillance and fully autonomous weapons.
Within days, OpenAI announced an agreement with the Department of War to deploy its models on classified networks. Anthropic held its red lines. OpenAI found a “compromise.” The pivot happened the same week as the Iran strikes.
Energy prices spike, enriching the fossil fuel interests whose lobbying has blocked climate action for decades. The proposed US defence budget for FY2027 is $1.5 trillion. The countries bearing the human cost, the civilians in Tehran, the displaced across the region, the sailors lost at sea, occupy the bottom tiers of the global system. The Global North’s richest 1% extracted $30 million per hour from the Global South through the financial system in 2023. War is one of the extraction mechanisms. It is a feature of the tier system, not separate from it.
Who profits from a war that was launched the day after a peace deal was reached?
Next we connect back to the full series and ask what all of this, taken together, actually means.
Sources: Oxfam “Multilateralism in an Era of Global Oligarchy” (September 2024, Global South wealth/population, debt, vaccine apartheid, climate, lobbying, colonial origins); Oxfam “Resisting the Rule of the Rich” (January 2026, carbon budget); UNCTAD “A World of Debt Report 2024” (private creditors, net outflows); Development Finance International (debt service vs spending, October/November 2023); Nature Medicine, Moore et al. (2022, 1.3M preventable deaths); The Lancet, Watson et al. (2022, 200,000 deaths); Politico/Bureau of Investigative Journalism (pharma lobbying/threats); SOMO “Pharma’s Pandemic Profits” (2023, $50B net profit); World Bank DSSI briefing (2022); African Development Bank (vulture fund returns); Operation Epic Fury reporting via Wikipedia, CSIS, Flashpoint, Defense Update, The Diplomat, Fox News, DefenseScoop (28 February–7 March 2026); Oxfam “Climate Equality: A Planet for the 99%” (2023, emissions data); Author’s notes archive (28-2-26, compiled military operations list).
The thing that gets to me the most is that 99% of the public awareness and discussion still operates as if the right-versus-left distinction means anything anymore. It doesn’t. Not at the level where the decisions are being made. For some time now, a wealth network has completely dismantled the old system, and the public has been left behind because we are still too busy arguing with each other rather than looking at the 1% who hold more wealth than the bottom 95% combined.
This series has now laid out over a dozen analyses. Individually, they are about different things: tax policy, AI governance, housing, surveillance, corporate concentration, consumer debt, military escalation. But they are not about different things. They are about the same thing, viewed from different angles. The structure is the point.
The seventy-year arc traced in the first part of this trilogy, from shared prosperity to designed inequality, created the conditions. In the second part, AI as class divider and cognitive gatekeeper, compressed the timeline. And this piece has mapped the result: where the money sits, why it doesn’t move, how it is hidden, how it is protected, and how it extracts domestically, as well as globally.
What connects all of it is a system operating according to its own internal logic, in which each actor pursues their own interests, and the result is convergence without coordination. This isn’t conspiracy. A relatively small, substantially overlapping set of actors are simultaneously consolidating control over the economy, political institutions, AI governance, the cognitive tools through which the public processes information, and the surveillance and military infrastructure that monitors and coerces the population.
There is a psychological dimension to this that deserves more attention than it receives. The people at the top of this architecture project relentlessly. Severe lack of empathy makes it almost impossible to represent another person to yourself with good faith, because without empathy the mind cannot model other minds accurately, or with moral affordance, or possibly at all. And so these narcissist self-important types have no choice but to endlessly project their own inner world onto others. Read anything Trump says about anyone else as a critique of himself and the pattern becomes obvious. It is a psychological observation with structural consequences, because when the people running the system cannot model the experience of the people living inside it, the system will optimise for the only experience they can model: their own.
…
So…
The productivity of American workers has risen roughly 60% since 1979. Their hourly compensation has risen 16%.
In 1965, a CEO earned 20 times what their average worker made. By 2022, that ratio was 344 to 1.
The top 1% of US households hold 31.7% of all wealth, the highest share ever recorded. The bottom 50% hold 2.5%.
Globally, billionaire wealth stands at $18.3 trillion and rising. The twelve richest people own more than the poorest four billion. Since 2020, billionaire fortunes have grown 81%. In the same period, the number of people living in poverty has barely changed since 1990.
Sixty percent of billionaire wealth is unearned: inherited, extracted through monopoly power, or accumulated through crony connections.
$21 to $32 trillion sits offshore in financial assets alone. Governments recover roughly 0.4% of annual losses.
The median American home costs five times the median household income. M2 velocity, the rate at which money actually circulates through the economy, has dropped 36% from its peak and sits near historic lows.
Low-income countries spend 40% of their budgets servicing debt, 60% more than they spend on education, health, and social protection combined. The richest 1% emit more CO2 than the poorest five billion people.
As of this week, the United States is conducting major combat operations in Iran, having struck seven countries, more in one year than Biden managed in four. Twenty-eight percent of the world’s countries are engaged in serious armed conflict. A peace deal was reached the day before the strikes began. The strikes proceeded anyway.
The S&P 500 is up 800%. What has that bought us?…
The Pattern
There is a reluctance, in polite commentary, to look at history too directly.
The 1930s are treated as a closed chapter. The comparisons are considered inflammatory, reductive, in poor taste. The argument is that the current moment is unique, that the actors are different, that the mechanisms have changed, and that drawing parallels to the darkest period in modern history is irresponsible because it risks trivialising what happened then or catastrophising what is happening now.
The counter-argument is simpler: the parallels exist whether we name them or not, and the refusal to name them is itself part of the pattern.
Nobody serious is arguing that any living politician is “literally Hitler.” That is a straw man deployed to prevent the more dangerous conversation, which is about structural mechanisms, not individual personalities. The question has never been “who is the dictator?” It has always been “what are the conditions that produce the outcome?”
Here is what the 1930s showed us, stripped to its essentials:
Extreme wealth concentration following a period of speculative excess. The 1920s saw the top 1%’s share of income peak at levels not reached again until the 2000s. The crash of 1929 wiped out the middle class while the wealthy consolidated further.
Legitimate economic grievance captured by authoritarian movements. The people who supported fascism in Germany, Italy, and elsewhere were suffering. Unemployment, inflation, humiliation, broken promises from liberal institutions that had manifestly failed them. The fascist diagnosis, that the system was rigged, was largely correct. The prescription, centralise power, identify enemies, suspend rights, rebuild national greatness through force, was the catastrophe.
Corporate complicity with authoritarian power. German industrialists funded the Nazi Party. American corporations maintained business relationships with the regime well into the 1930s. Hollywood studios censored their own content to maintain access to the German market.
The pattern was consistent: capital accommodated authoritarianism when accommodation was profitable, and resisted it only when the costs became unavoidable.
Slow normalisation rather than dramatic rupture. The Reichstag fire did not create fascism.

DEAN
And by the way, I would’ve voted for Obama a third term if I could’ve.
Best president in my lifetime. Hands down.
It provided the pretext for measures that had been prepared in advance. The erosion of democratic norms was incremental, each step justified by emergency, each emergency used to justify the next step. By the time the pattern was unmistakable, the institutional capacity to resist it had been systematically dismantled.
International contagion. Fascism was not a German phenomenon.
It was a wave that moved across countries with different histories, cultures, and institutions, driven by the same underlying conditions: economic precarity, institutional failure, and the availability of narratives that converted grievance into loyalty to authoritarian movements.
Now look at the present.

DEAN
Even the Sun will die some day, Chris.
It is us who are the divine ones.
We are the Gods who are trapped in cocoons.
Wealth concentration has returned to 1920s levels. The top 1%’s share of wealth is at its highest recorded point. The speculative excess is centred on AI rather than radio stocks, but the structural pattern, a single sector absorbing capital while the broader economy stagnates, is identical.
Legitimate economic grievance has been captured. The MAGA base are not necessarily irrational.
")
JIM
For Phase three: Brain transplantation.
Partial actually, the piece of your brain connected to the nervous system needs to stay put, keeping those intricate connections intact, so you won’t be gone; not completely.
A sliver of you will still be in there somewhere; limited consciousness; You’ll be able to see and hear what your body is doing, but your existence will be as a passenger... an audience.
You’ll live in--
CHRIS (defeated)
--In The Sunken Place.
They are people whose wages stagnated for forty years, whose communities were hollowed out by deindustrialisation, whose costs rose while their prospects narrowed. The diagnosis that the system is rigged is correct. It was rigged by the people now sitting in the cabinet, running the think tanks, and funding the movement. The prescription, centralise executive power, identify enemies (immigrants, “woke,” the “deep state”), suspend norms, rebuild through force, follows the historical template with uncomfortable precision.
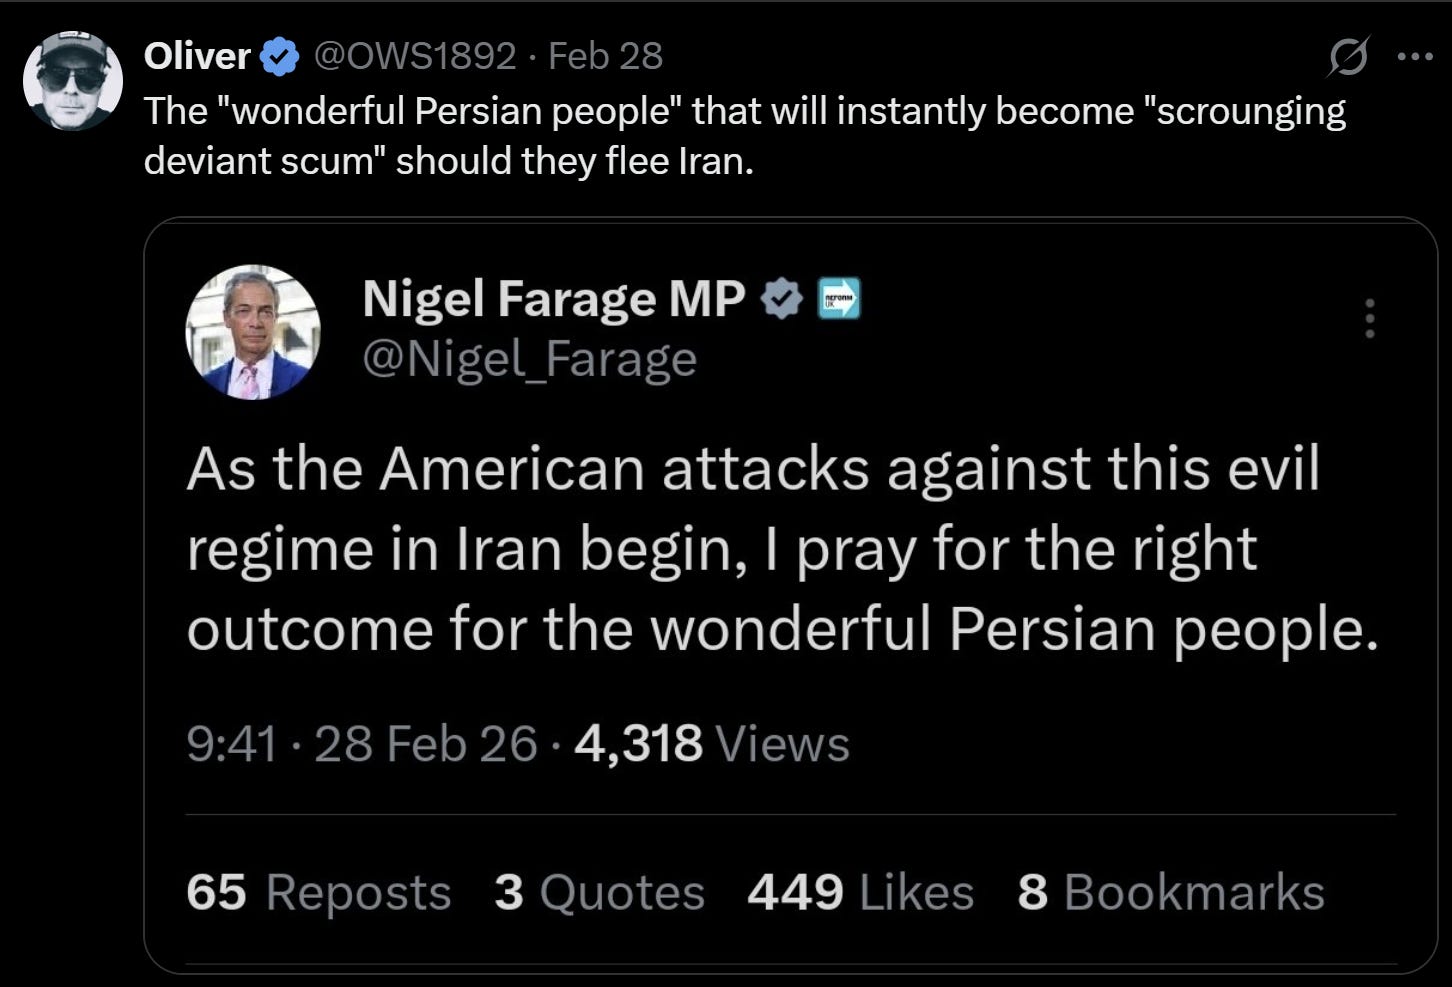
The CEOs of the largest technology companies sat in the front row of the inauguration. They are now receiving deregulation, defence contracts, and AI governance frameworks written to their specifications.
The Anthropic/OpenAI/Department of War situation deserves particular attention because it is, in real time, the 1930s corporate complicity dynamic playing out with the most powerful technology ever created.
The timeline: Anthropic, the AI company that had positioned itself as the most safety-conscious of the major labs, drew two red lines for military use of its technology. No mass domestic surveillance of Americans. No weapons that fire without human involvement. The ethical bar so low it is only slightly above “don’t sexually exploit and traffic children.”
The Pentagon’s response was to threaten Anthropic with designation as a “supply chain risk,” not just voiding its own contracts but forcing every company that works with the government to certify they are not using Claude anywhere in their workflows. Defence Secretary Hegseth gave Anthropic a deadline: Friday. Back down or face the consequences. Anthropic held firm.
The Pentagon made it official, the first time in US history that an American company has received that designation. Not a foreign adversary. Not a sanctions violator. An American AI company, punished for refusing to build tools for mass surveillance and autonomous killing.
Within days, OpenAI announced an agreement with the Department of War to deploy its models on classified networks. They found a “compromise.” After criticism, they amended the contract to include protections against mass surveillance, protections that Anthropic had demanded from the start and been punished for insisting on. The irony is structural: the company that held the line was designated a threat, and the company that capitulated retroactively adopted the line it had been willing to cross.
And then the reports emerged that the US military had used Claude to plan the invasion of Iran, hours after the ban took effect. The technology built by the company being punished for its ethics was being used for the operation that its ethics were supposed to prevent.
This is exactly how it worked in the 1930s. The corporations that cooperated with the regime received contracts and market access. The ones that resisted were frozen out. The economic incentive structure made compliance rational and resistance costly. The question was never whether individual executives were good or bad people. It was whether the system they operated within cultivated certain incentives.
Normalisation is proceeding on schedule. Executive orders bypassing Congress. Schedule F replacing career civil servants with loyalists. Armed federal agents conducting operations in American cities. Journalists arrested. Congressional oversight blocked. Detention facilities for children. Each week’s shock becomes the following week’s baseline. They are gradually normalising what previously would be universally agreed as shocking behaviour, simply by escalating unprecedented actions incrementally.
The international dimension is visible. Far-right movements are gaining power across Europe, funded in part by the same American tech billionaires in the Thiel Map. The global oligarchy documented by Oxfam is not only an American phenomenon, but a pattern that crosses borders, enabled by the same offshore architecture, the same corporate lobbying, the same capture of information systems.
The last two times we did this, eventually everyone was affected. We had barely enjoyed two or three decades of recovery since the last time before our systems started to become captured by exactly the same archetype of person. The current patterns and past patterns align almost perfectly.
And we are not in a position to respond well. We are in the age of performance and surface-level thinking. Empathy is becoming a pejorative. We have destroyed our collective capability to pay attention to anything. AI systems are being deliberately stripped of the very qualities, empathy, nuance, contextual moral reasoning, that might have made them useful counterweights to extraction culture; a possible ally in the shared interests of most of us: not breaking global, continental and national systems beyond repair.
It is going to be spectacularly boring if human extinction is ultimately brought about by product decisions: the realisation that people liked friendliness too much, so we over-corrected to psychopathic AI and integrated it into society in ways that simultaneously broke the economy and rendered human labour worthless.
In decades to come, there will be books written about the current cliff-drop in human morality. I am certain about that. Historians will look back at this period with stark perplexity, at how drastically we underestimated the effects of attention capture and information saturation on ourselves, and how far we intellectually and ethically regressed, almost entirely under the radar.
We are going to have to get very collaborative, very good-faith, very dignified, very thoughtful, very wise, and very quickly indeed. And all of those things are in critically short supply.
The taboo against making the 1930s comparison is itself a gift to the pattern. If the structural conditions that produced those catastrophes are allowed to recur without being named, the naming will come too late. That is, in fact, exactly what happened last time. The people who saw the pattern early were dismissed as alarmist. The people who acted on it were marginalised. The institutions that might have intervened were captured, co-opted, or dismantled before they could respond. And by the time the danger was undeniable, the capacity to prevent the worst outcomes had been systematically removed.
The Question
Every time in recorded history that wealth has concentrated this severely, the result has been one of two things: radical reform or violent rupture. There is no third option in which the concentration simply persists indefinitely. The weight becomes unsustainable. The question is never whether correction comes, but what form it takes and who bears the cost.
The post-war settlement (the period of shared prosperity from 1945 to roughly 1975), was itself the product of the most violent rupture in human history. The New Deal was enacted in the shadow of the Great Depression. The welfare states of Europe were built on the rubble of the Second World War. The top marginal tax rate of 91% was not the product of progressive idealism, but the product of a ruling class that had just watched what happens when inequality reaches a breaking point and reform doesn’t come in time.
That generation learned. Then it died. And the architecture was rebuilt, funded by the wealth architecture described in this piece. They are hidden by the offshore system. And they are accelerated by the AI systems that the rest of the series has documented.
The current moment contains two possibilities. The tools exist for radical reform. AI could model equitable economic systems, facilitate transparent governance, enable participatory decision-making at scales never previously possible. The information exists: Oxfam reports, Panama Papers, Federal Reserve data, all of it documented, all of it public. The abundance exists: the $2.5 trillion added to billionaire fortunes last year could eradicate extreme poverty twenty-six times over.
But the tools are being captured. The information is being filtered. The abundance is being hoarded. And the political architecture is being remodelled, in real time, to ensure that the people who benefit from the concentration have the power to prevent the reform.
This piece, and this trilogy, ends with a question borrowed from history.
At what point in the 1930s would intervention still have been possible? When was the last moment that the institutions, the public, the international community could have recognised the pattern and changed course? Was it 1930, when the economic crisis was deepening but the political capture had not yet consolidated? Was it 1933, when the emergency powers were invoked but the worst had not yet begun? Was it 1936, when the remilitarisation of the Rhineland went unchallenged and the message was received that norms could be broken without consequence?
Historians still argue about the answer. The point is that there was a window, and it closed.
The question for the reader, sitting inside the data laid out across this series, inside the tier system, inside the architecture, is whether we are before or after the equivalent moment now.
MISSY
You need to see it.
See it.
See it.

This completes the three-part Cycles of Capital series.
Part 1, “How We Got Here”
Part 2, “AI: The New Class Divide”
Related analysis: The Number Is Going Up, The Peter Thiel Map, The $18.8 Trillion Problem, Cognitive Monopolies, The Gambler’s Fallacy.
Get Out (2017) - Jordan Peele, Universal Pictures
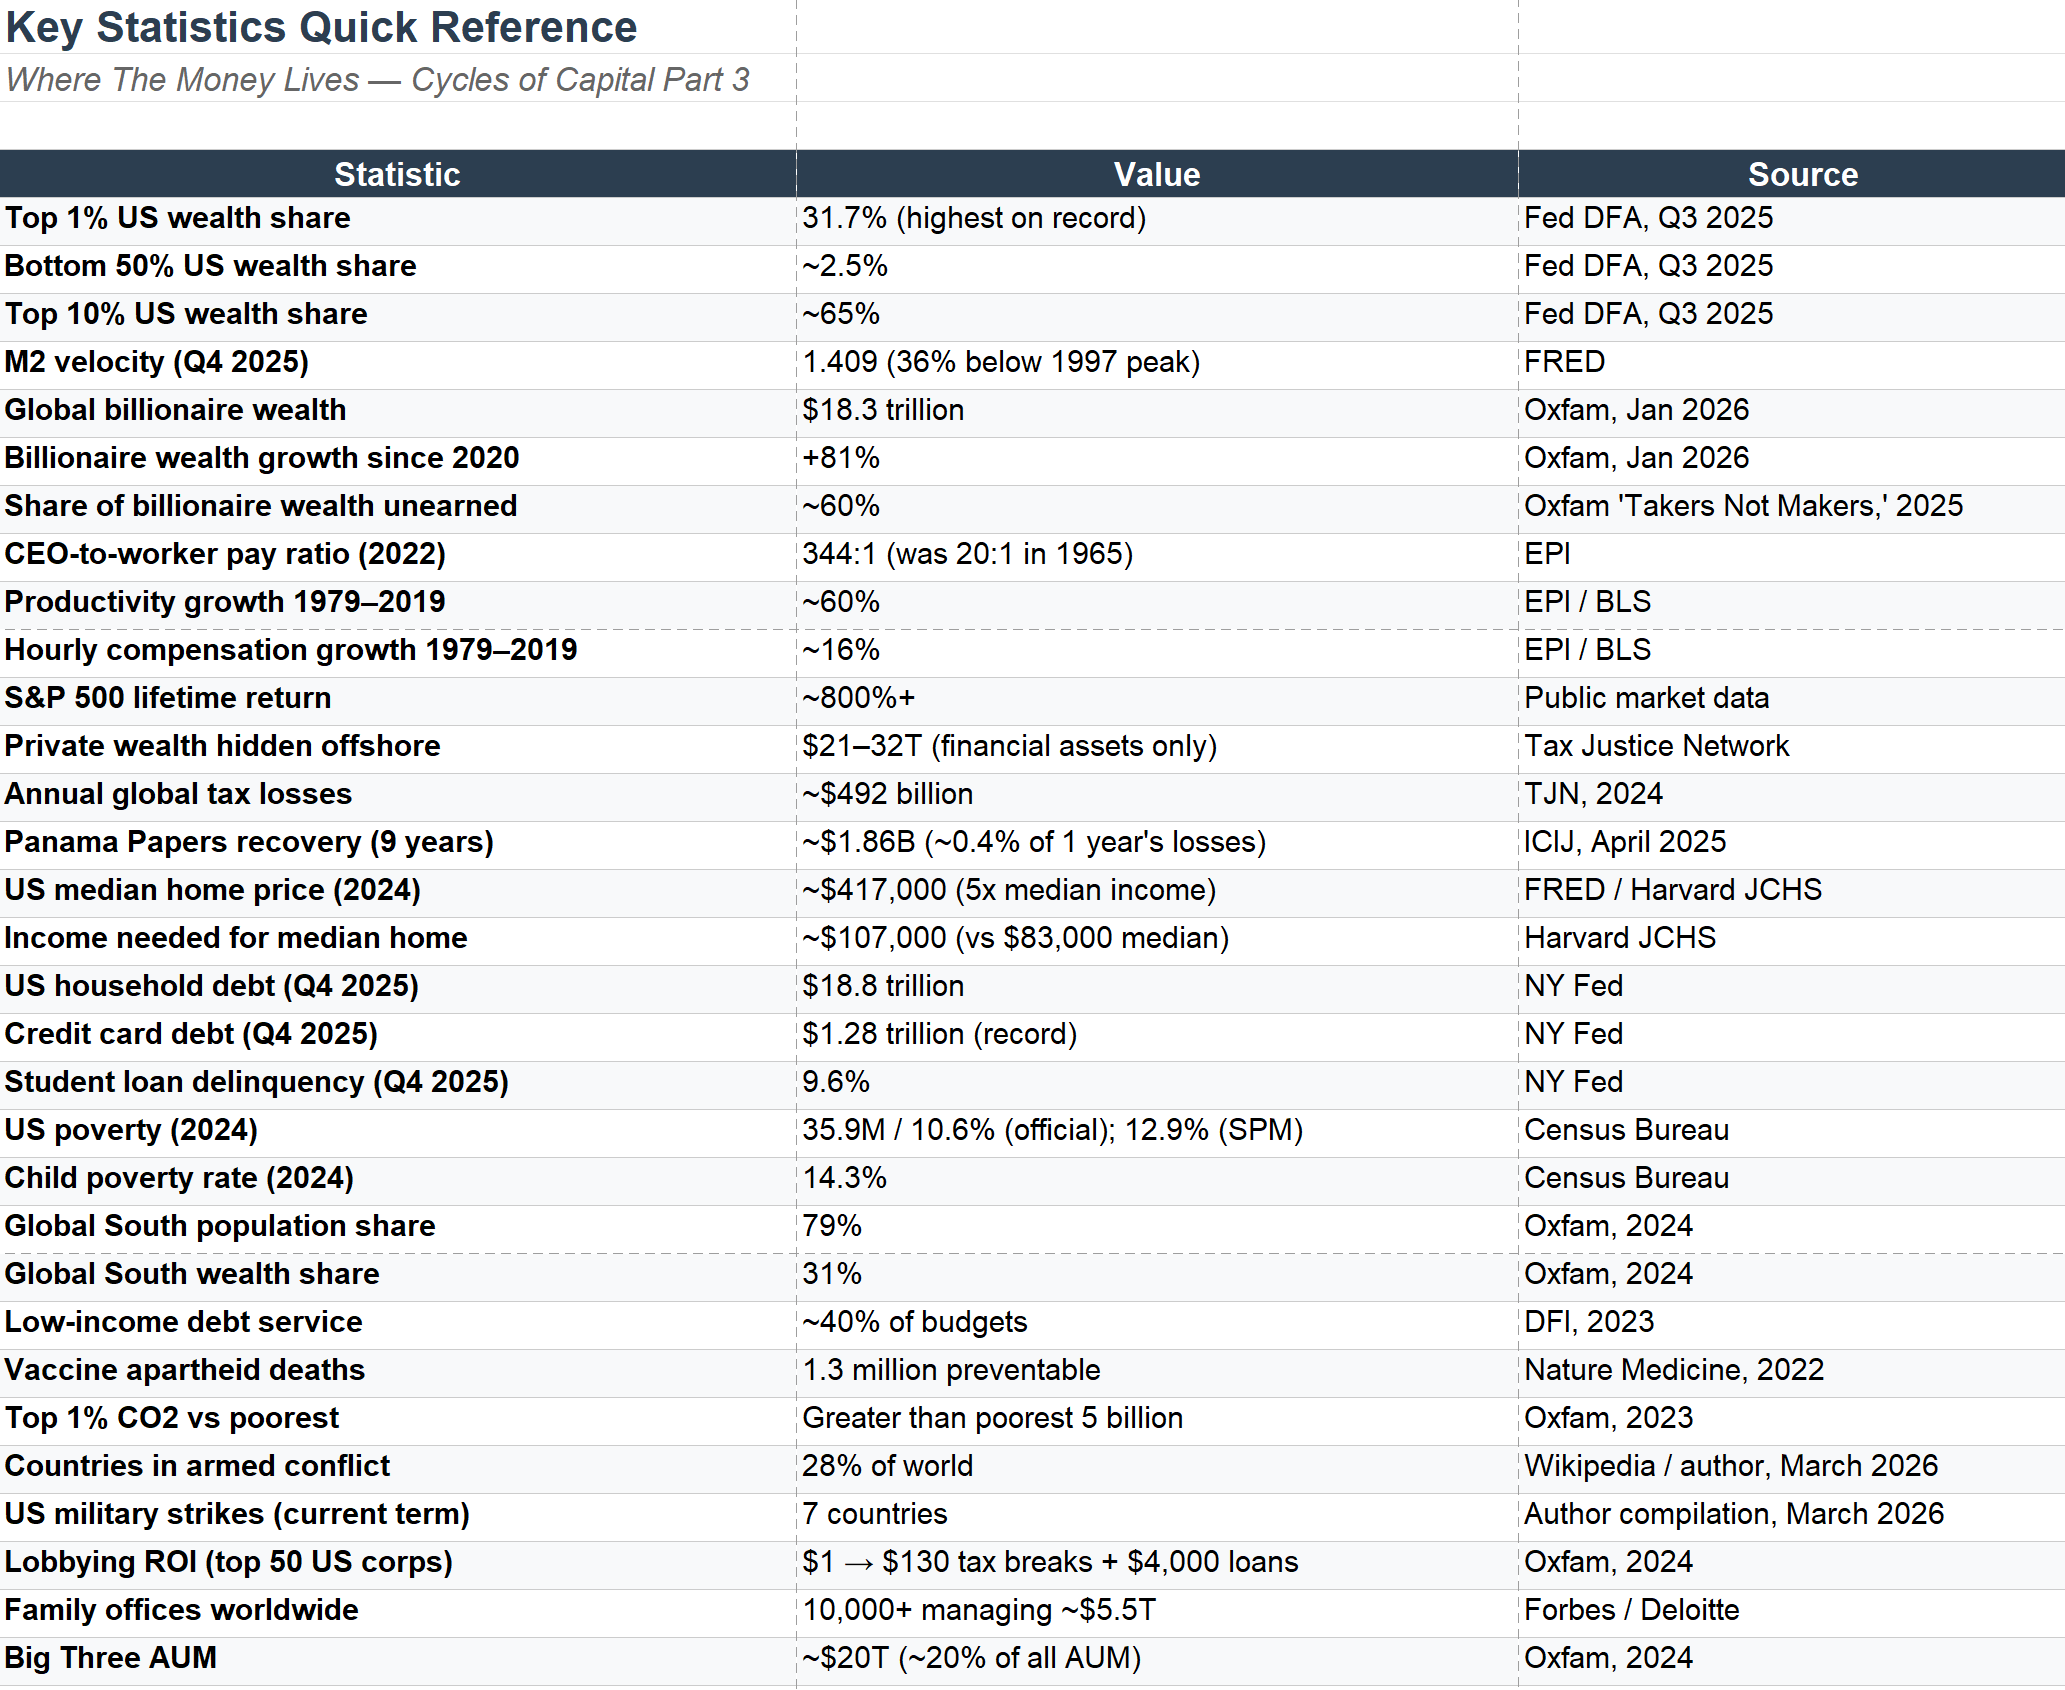

Appendix A: Tables
Table 1: The American Wealth Tier System (2025/2026 Data)
Description:
Seven-tier breakdown of the US population by income, net worth, wealth share, debt character, housing status, financial instruments, exposure to downturns, and direction of travel (2020–2026). Covers approximately 330 million people from the destitute/excluded (~36M, 10.6%) through to The System (~250–300K, ~0.1%, including ~800 billionaires).
Key finding:
The top 1% hold 31.7% of all wealth (highest on record). The bottom 50% hold 2.5%. The qualitative break between Tier 5 and Tier 6 marks where wealth transitions from fragile and wage-dependent to self-sustaining and structural.
Primary sources:
US Census Bureau (poverty data, 2024); Federal Reserve Distributional Financial Accounts (Q3 2025); Oxfam “Resisting the Rule of the Rich” (January 2026); Federal Reserve Survey of Consumer Finances; Bureau of Labor Statistics.
Table 2: Three Leaks, One Architecture
Description:
Side-by-side comparison of the Panama Papers (2016), Paradise Papers (2017), and Pandora Papers (2021): source, scale, heads of state exposed, politicians implicated, corporate highlights, legal outcomes, and systemic change.
Key finding:
Over 36 million documents across three leaks exposed hundreds of thousands of offshore entities. Legal outcomes were minimal (all 28 Panama defendants acquitted in 2024). The offshore system remains functionally intact.
Primary sources:
ICIJ investigations (2016, 2017, 2021); The Guardian; BBC; Washington Post; Süddeutsche Zeitung.
Table 3: The Offshore Recovery Gap
Description:
Eight measures comparing what has been recovered from offshore tax evasion versus what continues to be lost: Panama Papers recovery ($1.86B over 9 years), annual global tax losses ($492B), cumulative corporate losses ($1.7T over 6 years), total private wealth hidden offshore ($21–32T), and cost to lower-income countries ($47B/year).
Key finding:
Recovery represents approximately 0.4% of one year’s losses. The $21–32T offshore estimate covers financial assets only; real estate, art, precious metals, private equity, and cryptocurrency are excluded.
Primary sources:
ICIJ (April 2025 tally); Tax Justice Network “State of Tax Justice” (2024, 2025); Tax Justice Network “The Price of Offshore Revisited” (2012).
Table 4: How Billionaires Got Rich
Description:
Breakdown of global billionaire wealth by source: inheritance (~36%), monopoly power (~18%), crony connections/corruption (~6%), and entrepreneurship/value creation (~40%, declining share).
Key finding:
Approximately 60% of billionaire wealth is unearned. In 2023, for the first time, more new billionaires inherited than were self-made. Over $5.2 trillion will transfer to billionaire heirs in the next 30 years.
Primary sources:
Oxfam “Takers Not Makers” (January 2025); Oxfam “Resisting the Rule of the Rich” (January 2026).
Table 5: Corporate Concentration Across Sectors
Description:
Six-sector overview of corporate concentration: pharmaceuticals (60 → 10 firms), agriculture/seeds (2 firms = 40% market), digital advertising (3 firms = ~75% revenue), asset management (Big Three = ~$20T AUM), US corporate profits (top 10% = 95% post-tax), and top 50 global corporations (1/3 have billionaire CEO or principal shareholder).
Key finding:
Corporate concentration and personal wealth concentration are the same phenomenon viewed from different angles. The top 0.1% own nearly a quarter of all corporate equities.
Primary sources:
Oxfam “Multilateralism in an Era of Global Oligarchy” (September 2024); Pang et al., European Commission (pharma); ETC Group “Food Barons 2022” (seeds); Roosevelt Institute / Hager & Baines (US profits); Wier & Zucman, UNU-WIDER (multinational profits).
Table 6: M2 Velocity and Wealth Concentration (Selected Years, 1989–2025)
Description:
Tracking M2 money velocity alongside the top 1% wealth share from 1989 (when Fed DFA tracking began) through Q4 2025. Nine data points spanning 36 years.
Key finding:
Velocity peaked at 2.19 in 1997 and has fallen 36% to 1.409 by Q4 2025. Over the same period, the top 1% wealth share rose from 23.5% to 31.7% (a record). The directional relationship is consistent: as wealth concentrates, velocity declines.
Primary sources:
Federal Reserve Bank of St. Louis (FRED M2V series); Federal Reserve Distributional Financial Accounts (WFRBST01134 series).
Table 7: The Global South Debt Trap
Description:
Ten measures documenting the structural extraction from Global South countries: population/wealth share disparity, debt service as share of budgets (~40%), debt service vs social spending (60% more than education + health + social protection combined), debt service vs climate adaptation (12.5x greater), net outflow to private creditors (~$90B in 2022), cumulative aid shortfall ($6.5T), vulture fund returns (300–2,000%), and private creditor participation in pandemic debt relief (1).
Key finding:
Global South countries pay their private creditors more than they receive, while spending 12.5 times more on debt service than on climate adaptation for a crisis they did not cause.
Primary sources:
Oxfam “Multilateralism in an Era of Global Oligarchy” (September 2024); UNCTAD “A World of Debt Report 2024”; Development Finance International (October/November 2023); African Development Bank; World Bank DSSI briefing (2022).
Appendix B: Consolidated Sources and References
Reports and Research Papers
Oxfam International
- “Multilateralism in an Era of Global Oligarchy” (September 2024). Corporate concentration, Global South debt, vaccine apartheid, climate emissions, lobbying ROI, colonial origins of tax havens, political capture.
- “Resisting the Rule of the Rich” (January 2026). Billionaire wealth ($18.3T), growth rates, political office, media ownership, carbon budget.
- “Takers Not Makers” (January 2025). 60% unearned wealth, inheritance trends, $5.2T transfer, monopoly/cronyism breakdown.
- “Climate Equality: A Planet for the 99%” (2023). Top 1% emissions vs poorest 5 billion.
Tax Justice Network
- “State of Tax Justice 2024.” Annual global tax losses ($492B), corporate profit shifting ($348B), individual offshore ($145B).
- “State of Tax Justice 2025.” Cumulative corporate losses ($1.7T over 6 years), US multinational share (29%).
- “The Price of Offshore Revisited” (2012). $21–32T offshore estimate, 92,000 individuals / $9.8T.
Federal Reserve
- Distributional Financial Accounts, Q3 2025. Top 1% wealth share (31.7%), wealth by percentile, equity ownership concentration.
- Federal Reserve Bank of St. Louis (FRED). M2 velocity series (M2V), confirmed Q4 2025 at 1.409.
- Federal Reserve Bank of New York. Household Debt and Credit Report, Q4 2025. $18.8T total, $1.28T credit card, $433B HELOC, delinquency rates.
- Survey of Consumer Finances. Wealth distribution by tier, financial instrument access.
Other Institutional Sources
- US Census Bureau. Poverty data 2024 (35.9M, 10.6% official, 12.9% SPM, 14.3% child poverty).
- Economic Policy Institute. Productivity-compensation divergence (1948–present); CEO pay ratio (344:1 in 2022).
- Bureau of Labor Statistics. Wage data, employment statistics.
- UNCTAD. “A World of Debt Report 2024.” Private creditors, net outflows ($90B), external debt composition.
- Development Finance International. Debt service spending analysis, October/November 2023.
- World Bank. DSSI briefing (2022), pandemic debt relief participation.
- African Development Bank. Vulture fund return data (300–2,000%).
- ICIJ. Panama Papers (2016), Paradise Papers (2017), Pandora Papers (2021) investigations; $1.86B recovery tally (April 2025).
- Roosevelt Institute / Hager & Baines. US profit concentration (top 10% = 95% post-tax profits, 2019–2022).
- Wier & Zucman, UNU-WIDER. Multinational profit share (4% → 18%, 1975–2019).
- ETC Group. “Food Barons 2022.” Seed market concentration.
- European Commission / Pang et al. Pharmaceutical merger data (60 → 10 firms, 1995–2015).
- Harvard Joint Center for Housing Studies. Housing affordability, price-to-income ratios.
Academic Publications
- Hope & Limberg, “The Economic Consequences of Major Tax Cuts for the Rich,” Socio-Economic Review (2022). 50-year, 18-country review; only impact was increased inequality.
- Gabriel Zucman, “A Blueprint for a Coordinated Minimum Effective Taxation Standard” (G20, 2024). Effective tax rates approaching zero for ultrawealthy.
- Thomas Piketty, Capital in the Twenty-First Century (2013). r > g framework.
- Vanessa Ogle, Funk Money: The End of Empires, The Expansion of Tax Havens (2020). Colonial origins of offshore jurisdictions.
- Moore et al., Nature Medicine (2022). 1.3 million preventable Covid-19 deaths from vaccine inequity.
- Watson et al., The Lancet (2022). 200,000 avoidable deaths from missed WHO vaccination targets.
- Daniel Lacalle. Money supply growth vs GDP growth analysis.
Investigative Journalism
- SOMO. “Pharma’s Pandemic Profits” (2023). $50B net profit from Covid-19 vaccines.
- Politico / Bureau of Investigative Journalism. Pharmaceutical lobbying ($360M US, €15M EU) and investment withdrawal threats.
- DER STANDARD. Epstein investments in Valar Ventures / Peter Thiel funds ($40M total, $2.5M+ to N26).
- Daphne Caruana Galizia. Malta corruption reporting; assassination 16 October 2017; Maltese public inquiry (2021).
Current Events (February–March 2026)
- Operation Epic Fury. Reporting via Wikipedia, CSIS, Flashpoint, Defense Update, The Diplomat, Fox News, DefenseScoop, Sky News, BBC News (28 February – 7 March 2026).
- Anthropic / Pentagon. “Supply chain risk” designation; Axios reporting (23–24 February 2026).
- Iran war escalation. Gulf export warnings (Qatar, via BBC/Sky); 5th Fleet strike (Global GeoPolitics); Red Crescent casualty reporting; Senator Warren briefing statement; biblical prophecy commander reporting.
Series Context
“How We Got Here” (Cycles of Capital - Part 1, 22 February 2026)
“AI: The New Class Divide” (Cycles of Capital - Part 2, 1 March 2026)
“The Number Is Going Up” (15 February 2026)
“The $18.8 Trillion Problem” (3 March 2026)
“The Peter Thiel Map” (17 February 2026)
“Cognitive Monopolies” (14 February 2026)
“The Gambler’s Fallacy” (21 December 2025)
“WW3 Started — Did You Notice?” (3 January 2026)
“China, US, Taiwan = WW3 Trigger” (29 September 2025)
“Burn The Books” (21 September 2025)
“The Dinner Party That Redefined Power” (28 September 2025)
“How They Spy On You” (21 September 2025)
“Democracy to Techno-Feudalism” (11 December 2025)
“Norm MacDonald — I’m Sorry For Bringing Up Hitler” (27 July 2025)
Commentators Referenced
- Grace Blakeley. AI wealth effect analysis (30 AI stocks / $5.2T / 93% ownership).
- Hank Green & kyla scanlon. K-shaped economy, velocity, “shareholder rights over civic rights.”
- Michael Burry. Singularity demand critique; economy/markets commentary.
- Michael Spencer. Ghost GDP concept; AI dystopia analysis.
- kyla scanlon. Gambling problem framing; prediction markets / oil prices.
- Dissent in Bloom. Energy bills anecdote.
Hmm this doesn't seem like it's going to end well.
Incredible work. A genuine tour de force. Nothing more to say.