
The Number Is Going Up


“Are we in a phase where investors as a whole are overexcited about AI?
My opinion is yes.
Is AI the most important thing to happen in a very long time?
My opinion is also yes.”
— Sam Altman, CEO of OpenAI, August 2025
The Economy That Fails Whether It Succeeds or Not
AI Speculation, Market Concentration, and the Upward Vacuum of Value
By some estimates, AI-related investment accounted for over 90% of US GDP growth in the first half of 2025. Even the most conservative analyses put the figure at 20–37%. Strip out AI capex, and the American economy is barely growing.
That single statistic reframes everything. When the Torsten Slok analysis circulated showing that the US price-to-earnings ratio had surged 40% above the global average—driven almost entirely by tech valuations—it raised a question that sounds simple but unravels the entire economy when you pull the thread: is this actually good?
The S&P 500 has returned roughly 87% over the past five years. The Russell 2000, tracking the next 2,000 largest companies after the top 1,000, returned about 17%. Private middle-market firms are fighting to stay flat. Main Street small businesses are increasingly underwater. The “number going up” is real—but it’s going up unevenly, and the mechanism driving it may be building an economy that breaks whether the underlying bet pays off or not.
This article traces that thread from GDP dependency to market concentration to corporate consolidation to AI capital expenditure to the fundamental paradox at the heart of the current boom: the companies driving the market are betting on a technology that, if it works, could hollow out the consumer demand that sustains the economy—and if it doesn’t, reveals the biggest speculative bubble since the dot-com era.
Part 1: The GDP Illusion
An Economy Propped Up by Five Companies
In the first half of 2025, AI-related spending on servers, networking equipment, and data centre construction outpaced the US consumer as an engine of economic expansion. That is an extraordinary inversion: the American economy has been consumer-driven for decades, with household spending powering roughly 70% of GDP. For a category of corporate capital expenditure to rival and, by some measures, exceed that contribution signals something unusual.
The estimates vary, and the range itself is telling. At the high end, some analysts have suggested AI investment accounted for as much as 92% of US GDP growth in the first half of 2025—essentially arguing that without the AI buildout, the economy would have been flat or contracting. More moderate estimates place AI’s contribution at 20–37% of real GDP growth during the first three quarters of 2025, with consumer spending still technically the largest single driver but AI capex growing far faster and providing the marginal growth that separates “expansion” from “stagnation.”
The concentration is striking. This growth is not coming from thousands of businesses investing in AI across the economy. It is being driven by a small group of hyperscalers—Meta, Alphabet, Microsoft, Amazon, and Oracle—spending hundreds of billions on infrastructure.
Data centre construction has grown over 400% since 2019, and by mid-2025 it rivalled the construction of traditional office space in scale.
Sources: Multiple analyst estimates compiled from Deutsche Bank, Goldman Sachs, and independent research through H1 2025. Data centre construction growth figure from industry reports through mid-2025.

Growth vs. Level: The Sustainability Problem
There is an important distinction between a high level of spending and growth in spending. GDP measures change. If Big Tech spent $427 billion on capex in 2025 and spends $650 billion in 2026, the increase of $223 billion contributes to GDP growth. But if spending then plateaus at $650 billion in 2027, the contribution to GDP growth drops to zero—even though the spending level remains enormous. This means the AI sector has to keep accelerating just to maintain its contribution to growth, a dynamic that resembles a treadmill more than a foundation.
Meanwhile, the import effect complicates the picture further. Much of the AI hardware—Nvidia GPUs, networking equipment, specialised chips—is manufactured abroad. When US companies import $100 billion in AI chips, that spending appears as investment in GDP calculations but is partially offset by rising imports, reducing the net domestic multiplier. The headline contribution of AI to GDP is likely somewhat overstated relative to its actual domestic economic impact.
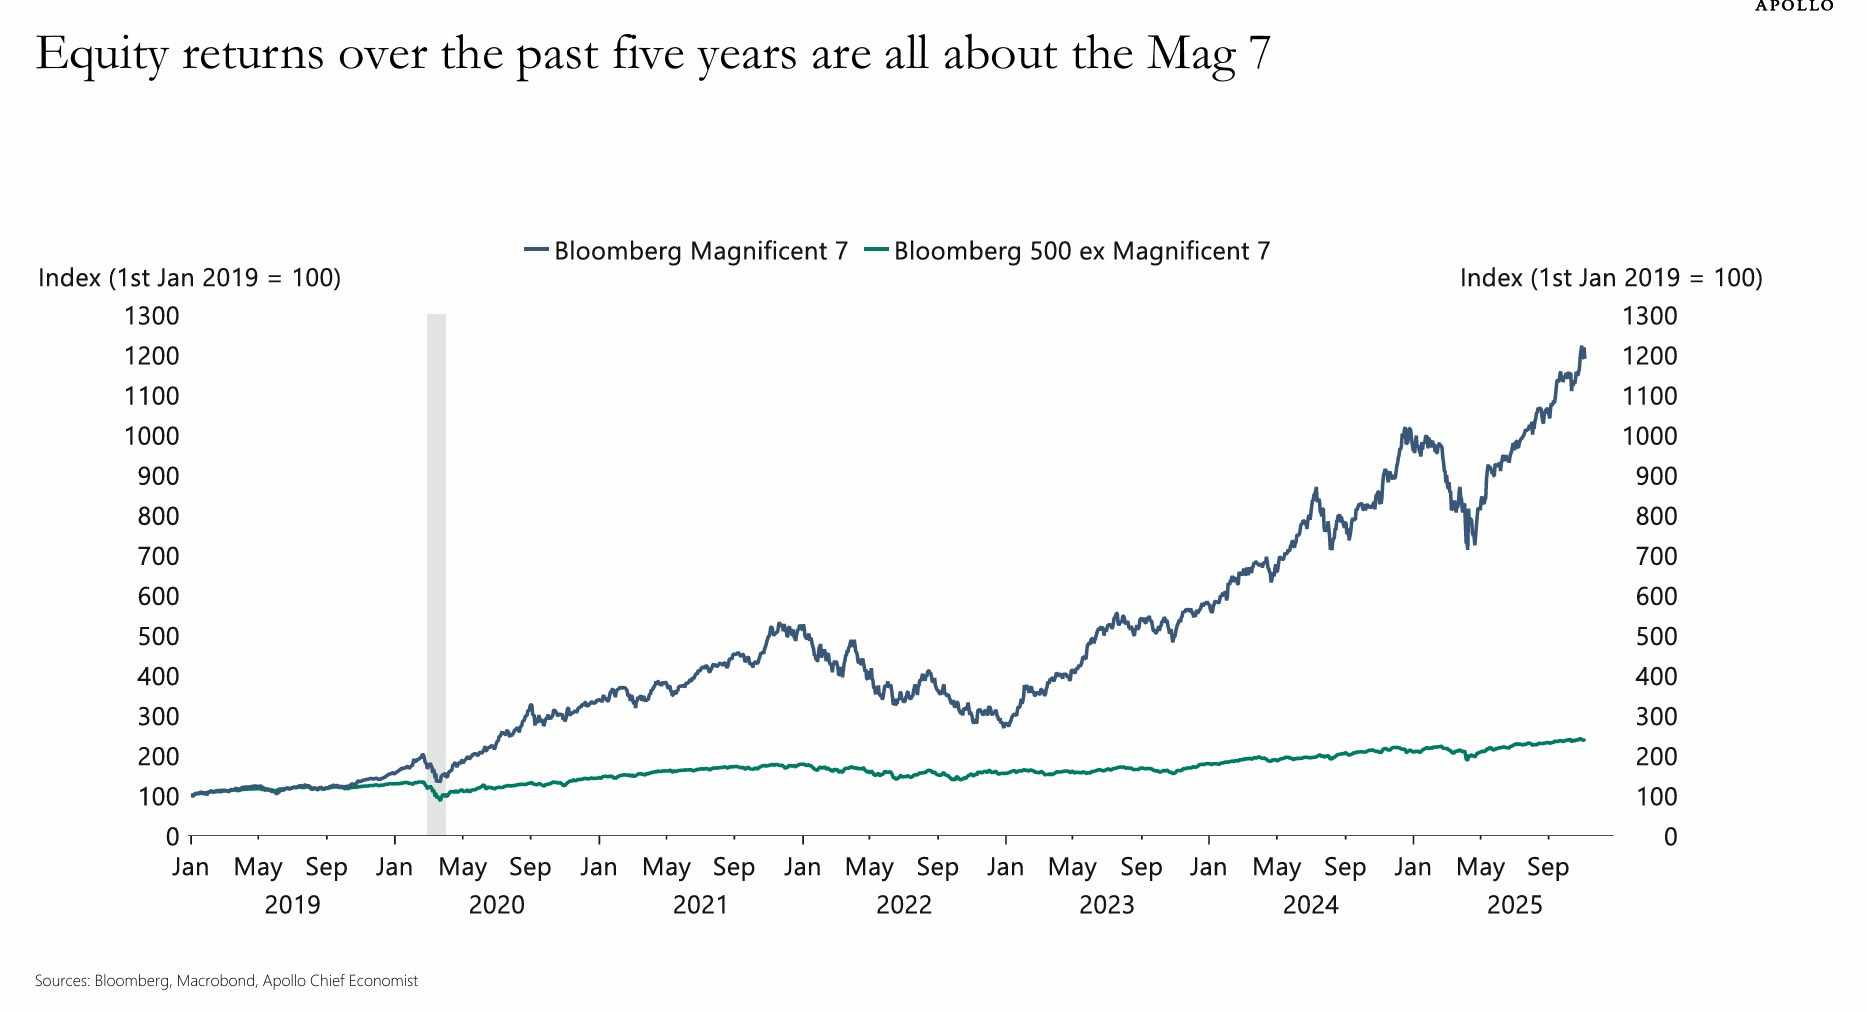
What the Rest of the Economy Is Doing
Perhaps the most important finding in this data is what it reveals about the non-AI economy. As Deutsche Bank research has documented, while US investment in AI-related industries surged over the past five years, non-AI investment remained stagnant. The AI boom has added resilience to headline economic numbers, offsetting slowing consumption and higher interest rates—but it has done so by masking a relatively muted, or flat, investment environment everywhere else.
This is the foundation of the argument that follows: the US economy is not broadly healthy with AI as an additional growth engine. Rather, AI capex is increasingly the growth engine, and everything else is treading water. That distinction matters enormously for understanding what happens if AI spending slows, and for understanding who benefits from the “growth” being recorded.
Part 2: The Great Narrowing
A Market of the Few
The S&P 500 is no longer a broad measure of the American economy. It is increasingly a measure of a handful of technology companies trading on future expectations. As of January 2026, the ten largest companies account for approximately 38–41% of the entire index’s market capitalisation—more than double the roughly 19% they represented in 2015. During the height of the dot-com bubble in 2000, the top ten reached only about 25–27%. We are significantly more concentrated today than we were at the peak of the last major tech bubble.
Sources: RBC Wealth Management/FactSet (year-end 2025 data); Wikipedia/S&P Dow Jones Indices (Jan 2026 weightings: Nvidia 7.17%, Alphabet 6.39%, Apple 5.86%, Microsoft 5.33%, Amazon 3.98%, Broadcom 2.51%, Meta 2.49%, Tesla 2.31%, Berkshire Hathaway 1.68%, Eli Lilly 1.55%).
Over $40 trillion is now invested in index funds that track the S&P 500. Every dollar flowing into these passive vehicles disproportionately inflates the largest constituents, increasing their weight, which attracts more passive capital, which increases their weight further. RBC Wealth Management describes this as a “passive concentration trap”—a feedback loop where market structure amplifies dominance regardless of underlying fundamentals.
Critically, weight has outrun earnings. In 2025, the top ten stocks represented about 41% of the index’s total weight but were expected to generate only about 32% of its earnings. In 2015, weight and earnings contribution were closely aligned. The gap is growing, which means valuations are increasingly untethered from profitability.
The AI Correlation Risk
What makes today’s concentration uniquely dangerous, compared to prior peaks, is that the top companies are not diversified across sectors. They are almost universally linked by a single theme: artificial intelligence. Unlike past periods when the top ten spanned energy, finance, consumer goods, and technology, today’s leaders are closely correlated.
As RBC notes, this effectively turns the S&P 500 into a directional bet on AI adoption and monetisation. If expectations slip or timelines extend, there are fewer offsetting exposures within the index to absorb the impact.
The Longer View: Platform Economics Since 2008
The all-time charts reveal something the five-year view obscures: the current AI-driven concentration is not a sudden aberration. It is the latest—and most extreme—phase of a structural shift that began in earnest after the 2008 financial crisis.
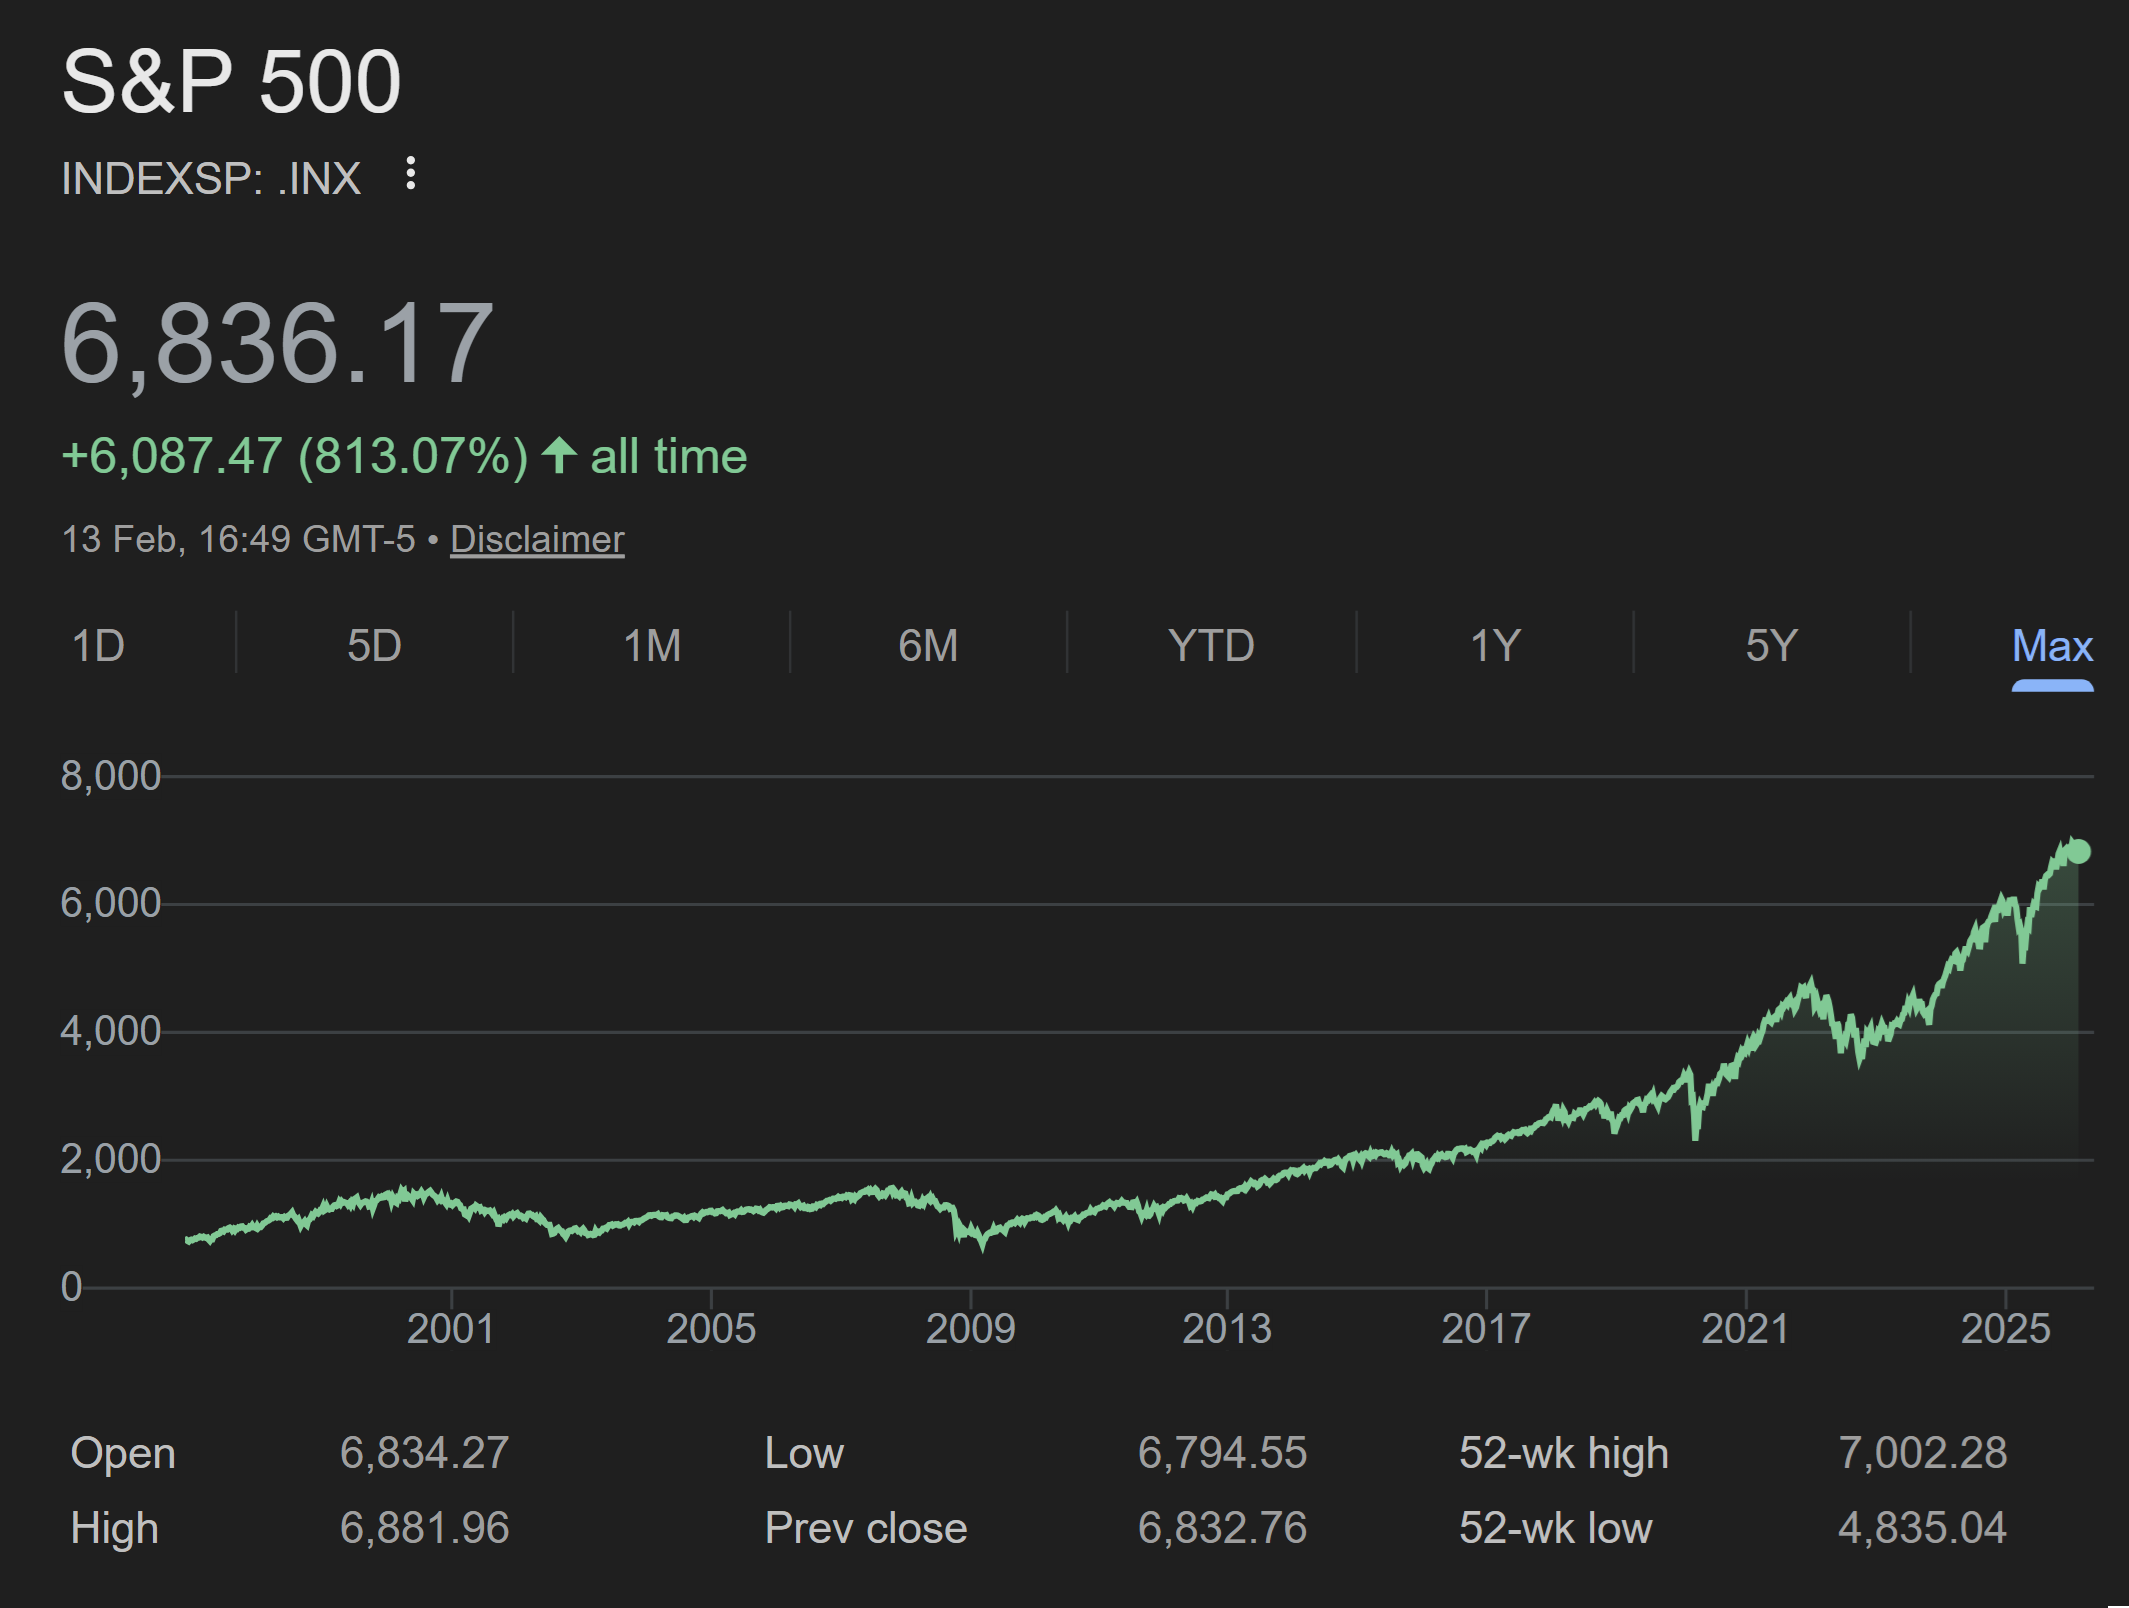
S&P 500: +813% all time. Note the inflection point post-2008.
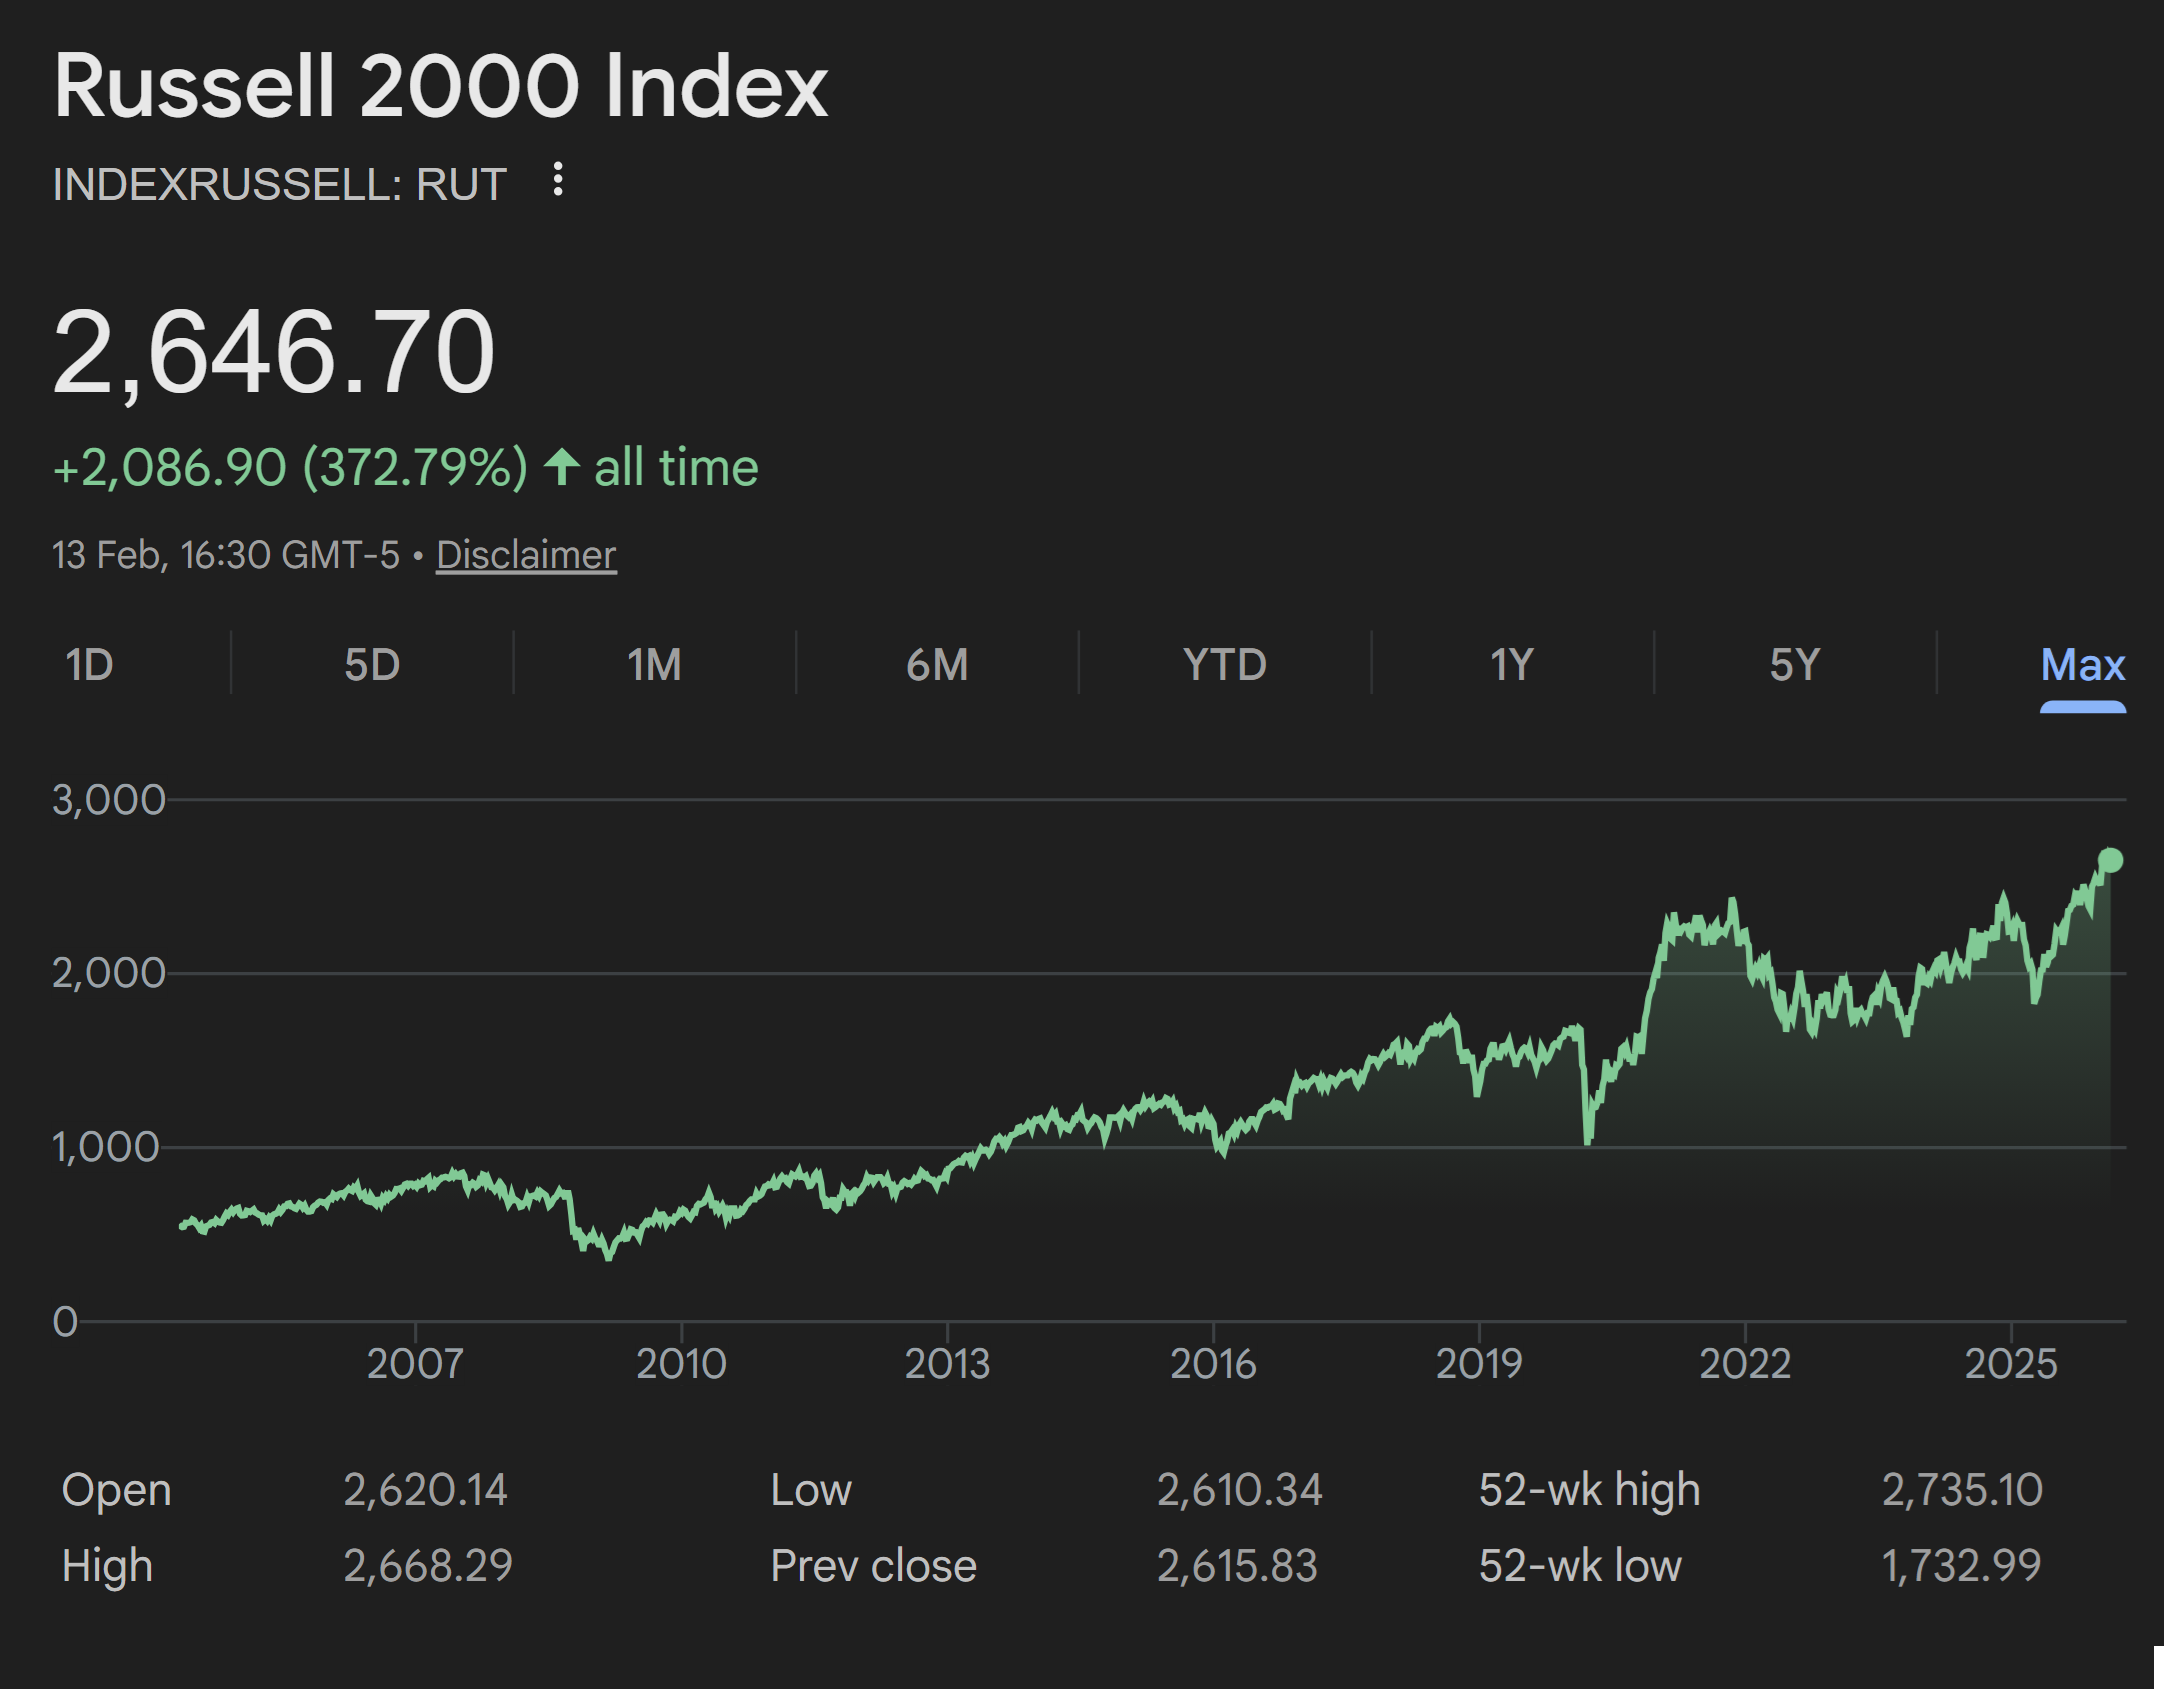
Russell 2000: +373% all time. Growth broadly tracks the S&P until ~2020, then the gap explodes.
Look at the S&P 500’s all-time trajectory. From the late 1990s through 2008, it traded in a broad range—roughly 1,000 to 1,500. Then, starting around 2009, it began a nearly unbroken ascent that accelerated through every subsequent phase of platform capitalism. That inflection point is not coincidental. It marks the moment the “platform economy”—built on network effects, near-zero marginal costs, advertising-driven revenue, and data extraction—became the dominant engine of corporate value creation.
Consider the timeline: Facebook hit 100 million users in 2008, introduced the Like button in 2009, and crossed one billion users by October 2012. The PayPal Mafia companies—LinkedIn, YouTube, Tesla, Palantir, Yelp—were all scaling during exactly the same period. Instagram launched in 2010. Uber in 2009. These companies didn’t just grow; they redefined what “growth” meant for public markets. They proved that capital-light businesses could scale to billions of users while employing relatively few people, generating enormous market caps with minimal connection to the physical economy of wages, manufacturing, and local commerce.
The S&P 500 chart from 2009 onward is, in significant part, the story of this model being rewarded, replicated, and concentrated. Each wave—social media, cloud computing, mobile, streaming, e-commerce—funnelled value into the same small set of platform companies. The AI wave is the latest and largest iteration of this pattern, but the underlying dynamic has been running for nearly two decades: a small number of technology companies capturing an ever-growing share of corporate profits while the broader economy stagnates.
Meanwhile, look at what “growth” has meant for everyday Americans during this same period. Housing affordability has collapsed: median home prices have risen over 60% since 2015 while median wages grew roughly 25%. Rent consumes an increasing share of household income. Healthcare, education, and childcare costs have all outpaced wage growth. The S&P 500’s trajectory looks like prosperity—but the prosperity has been captured by asset holders and the companies they own shares in, not by workers or consumers. The index measures wealth creation for shareholders; it does not measure whether the economy is working for the people who live in it.
Part 3: The Fractal Divergence
Large Caps vs. Small Caps
The divergence between the top and the rest isn’t just a feature of how the S&P 500 is weighted—it’s visible across entirely separate indices. Over the past five years, the S&P 500 has returned roughly 75%, while the Russell 2000 has returned roughly 17%. That’s a four-to-one ratio of returns. The charts below tell the story more viscerally than any statistic:
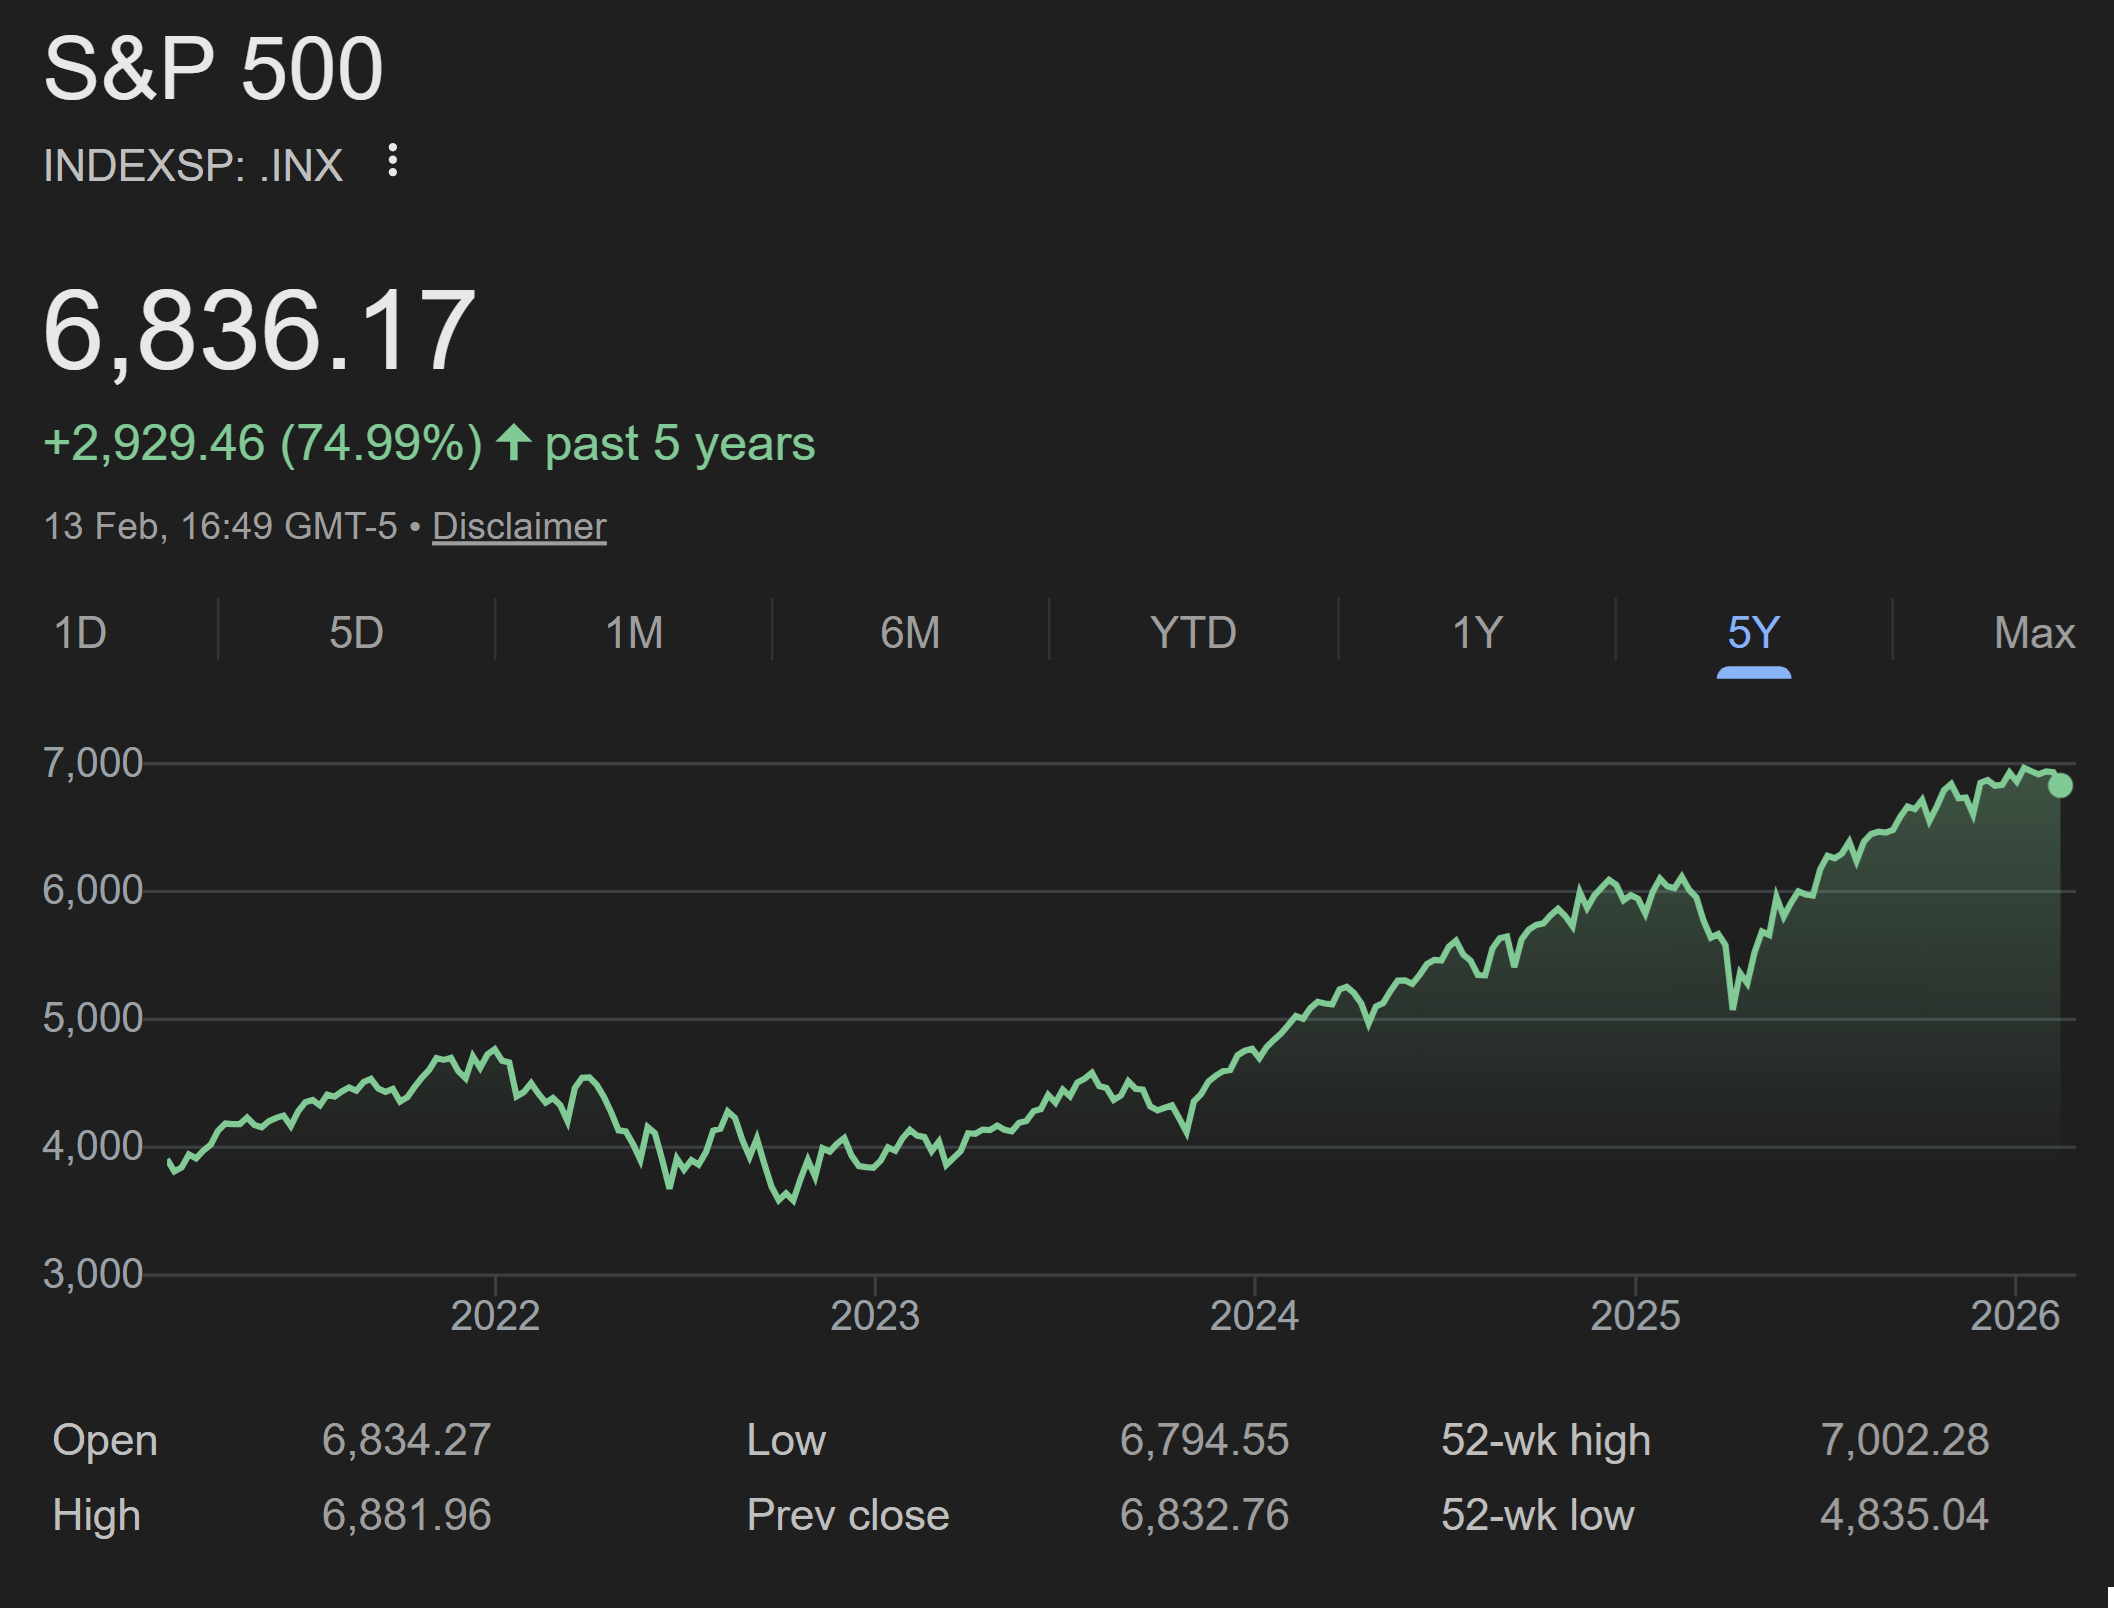
S&P 500: +74.99% over 5 years (13 Feb 2026)
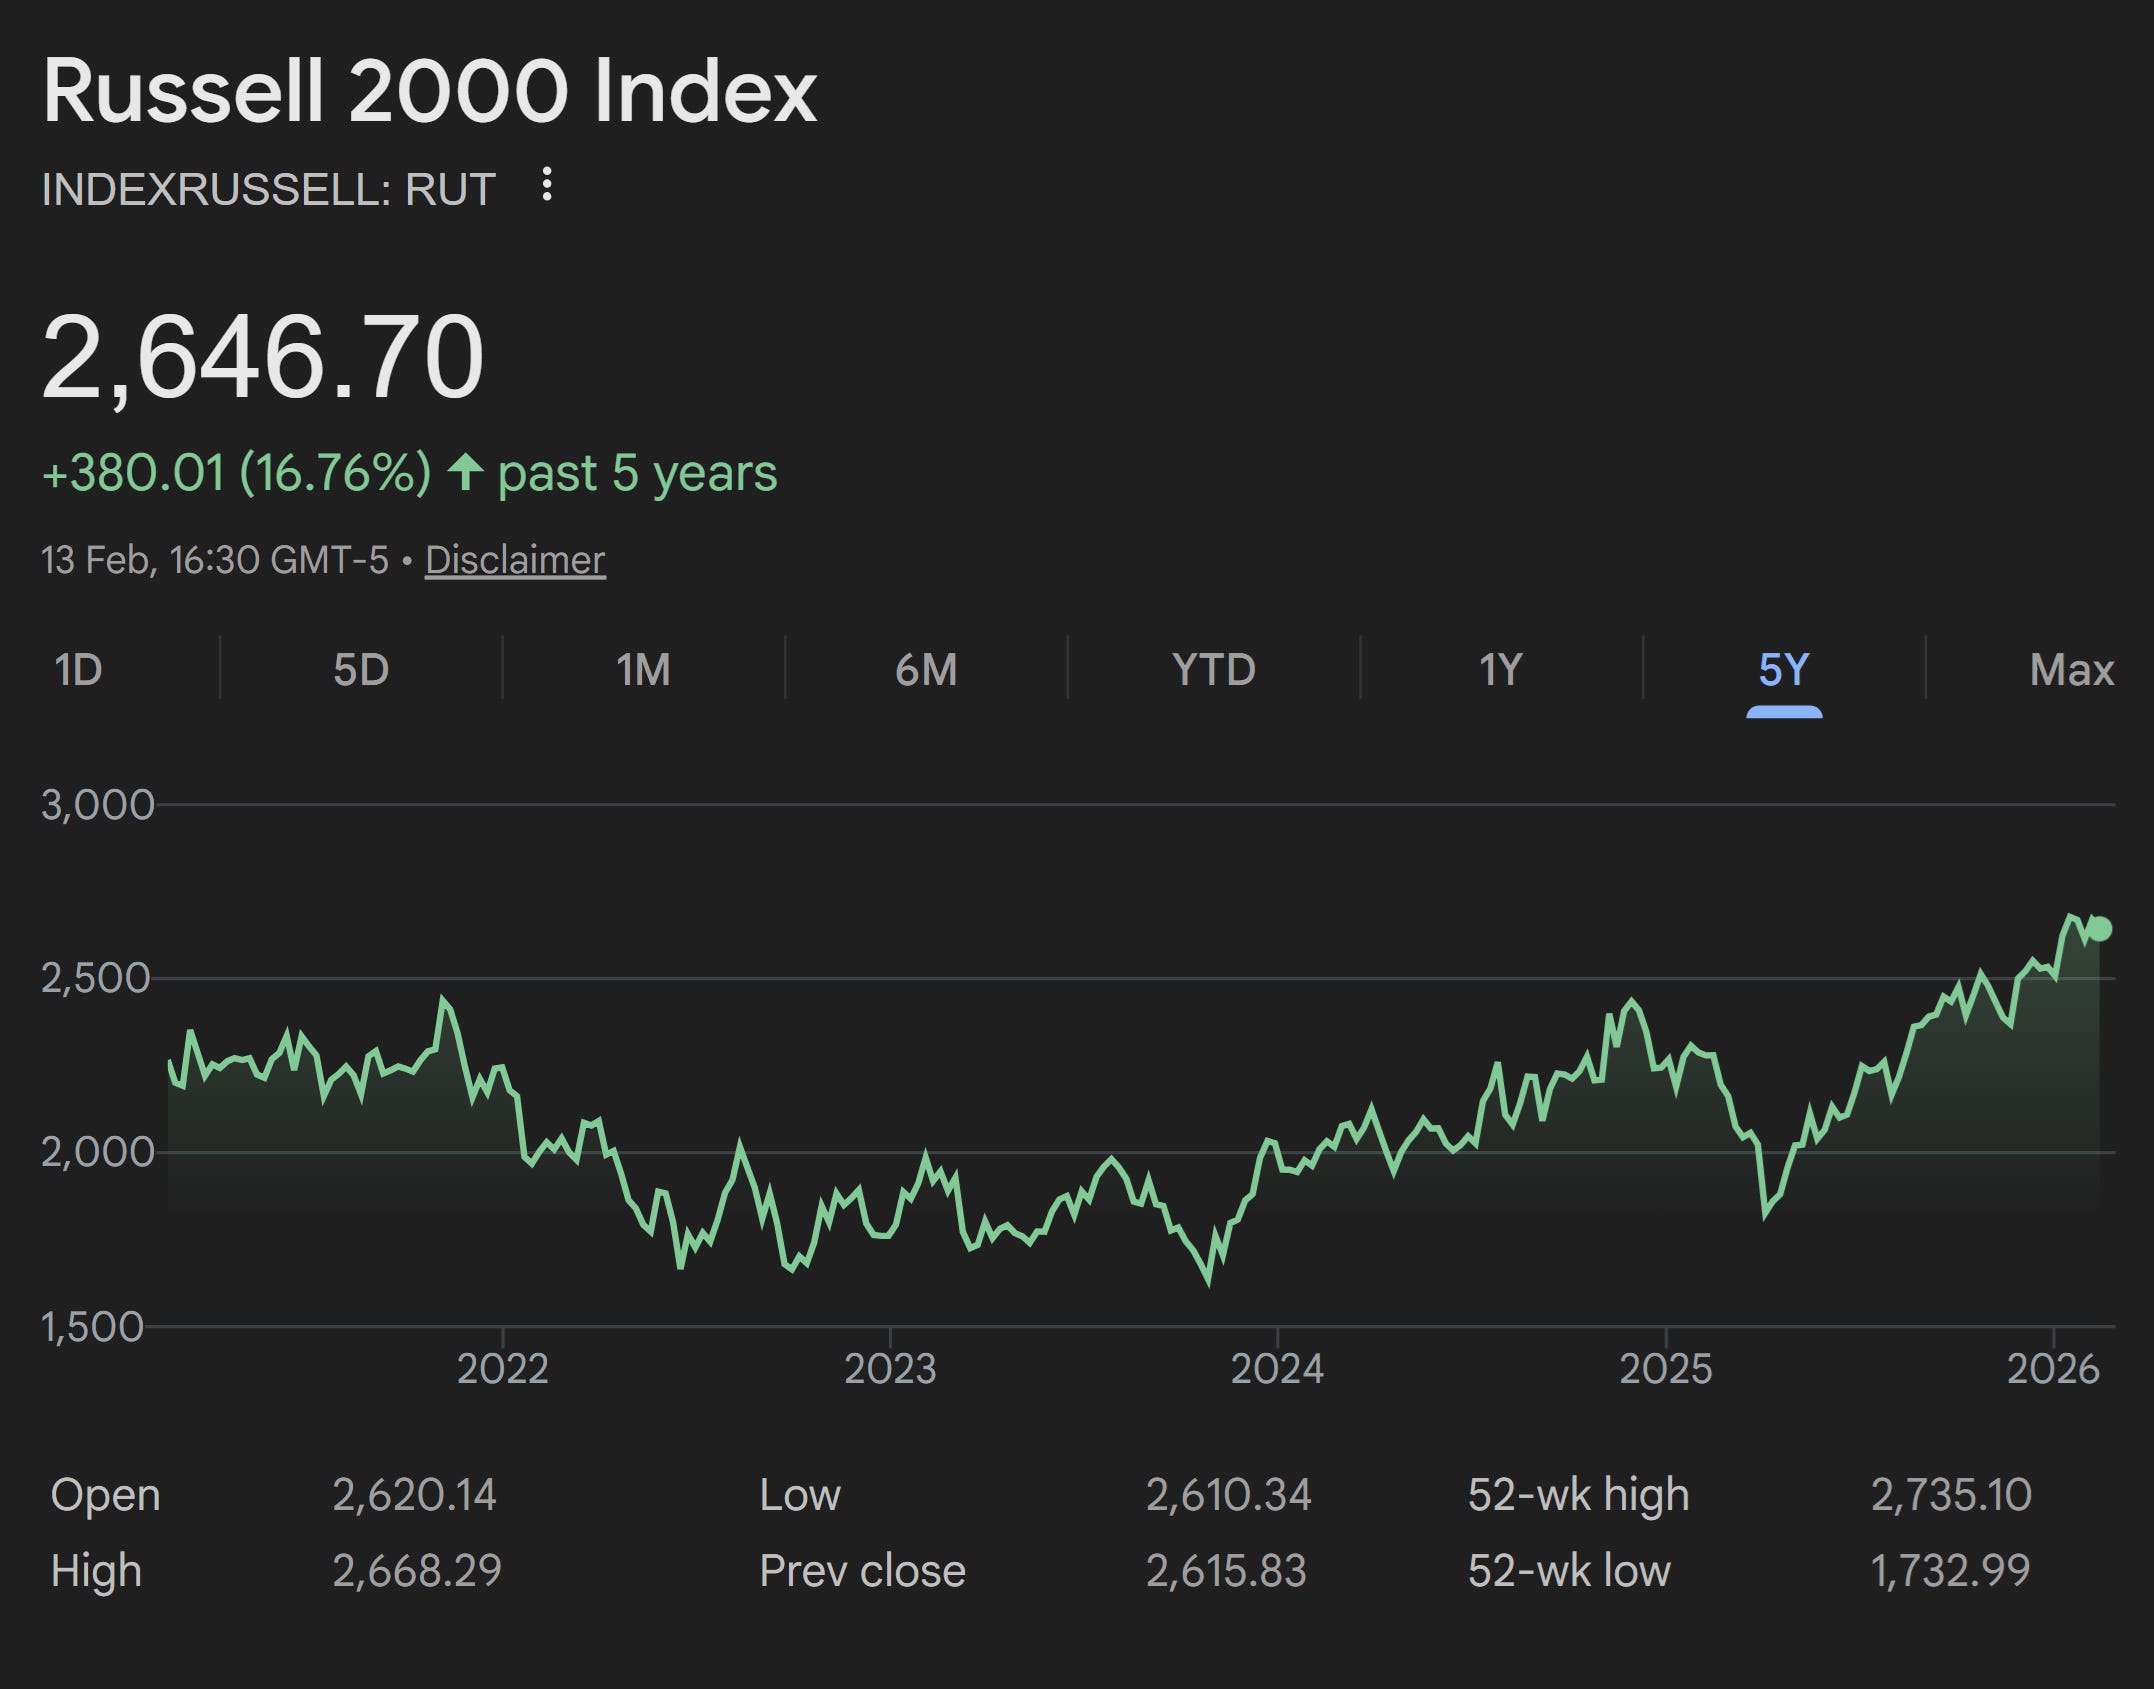
Russell 2000: +16.76% over the same 5 years (13 Feb 2026)
Both indices dipped during COVID (2020) and tariff escalations (2025), but recovered unevenly. The S&P 500 powered to new all-time highs above 7,000 in January 2026; the Russell 2000 only recently broke back above its 2021 peak, and even that required an 18% surge in a single week following a cooler-than-expected inflation print.
The mechanics of this divergence matter. Large-cap companies in the S&P 500 are traded predominantly on forward price-to-earnings ratios—investors are paying for expected future profits, heavily influenced by AI hype and capital-light business models. Small-cap companies in the Russell 2000 are priced on trailing earnings—the actual reality of high interest payments, labour costs, and operating expenses.
The reason is debt. Large-cap S&P 500 companies are overwhelmingly cash-rich; they locked in low interest rates years ago through fixed-rate borrowing and many sit on enormous cash reserves—collectively over $420 billion as of late 2025. Small-cap companies in the Russell 2000, by contrast, rely heavily on floating-rate debt. Around one-third of Russell 2000 debt is short-term and floating-rate, meaning when the Federal Reserve held rates high, these companies’ interest costs rose immediately and directly. Their aggregate interest coverage ratio (EBITDA to interest expense) is less than one-third of the Russell 1000’s, and 87% of their outstanding debt is rated high-yield. The rate environment doesn’t just disadvantage them—it strangles them.
Sources: Brown Advisory; Neuberger Berman analysis of Russell 2000 balance sheets.
Around 40–44% of Russell 2000 companies are currently unprofitable, up from about 14% two decades ago. Many of these are zombie firms—companies kept alive by access to public capital markets despite generating no profit. Apollo Global Management’s chief economist Torsten Slok (the same analyst whose P/E comparison sparked this investigation) has flagged this directly, and Morgan Stanley’s CIO Lisa Shalett has noted that small-cap cost of capital now significantly exceeds return on assets.
Sources: Apollo Global Management (Torsten Slok, Oct 2025); Morgan Stanley (Lisa Shalett weekly note, Oct 2025); Visual Capitalist (42% figure, Dec 2024); Aristotle Funds/FactSet (39% as of June 2024); Brown Advisory (40%+ each year); Investing.com (43% as of 2025).
Bank of America has declared the S&P 500 “frothy to bubbly,” noting it now exceeds its March 2000 levels on nine of twenty valuation metrics they track, including market-cap-to-GDP, price-to-book, and enterprise-value-to-sales.
The Wilshire 5000—which tracks virtually all actively traded US stocks—makes the distortion even clearer. Analysis of the index during the 2023–2024 boom years showed that if you stripped out the technology sector, the remaining thousands of businesses often showed flat or negative returns. The “whole economy” wasn’t booming; a specific sector was acting as a jet engine strapped to a struggling train. That dynamic has only intensified through 2025 and into 2026.

Economists describe this as a “K-shaped” recovery or market: the top arm of the K rises steeply (the S&P 500, powered by AI and mega-cap cash flows), while the bottom arm slopes downward or flat (the Russell 2000, private businesses, workers in non-AI sectors). It is not a rising tide lifting all boats. It is two economies diverging from the same starting point, with the gap widening every quarter.
But the Russell 2000 Is Still “Rich”
Here’s the insight that extends this beyond a stock-market story into an economy-wide one: the Russell 2000 companies are not small businesses. Their weighted average market cap is around $4.5 billion. They have access to public equity markets, analyst coverage, and institutional investors. If a local private business lost money for five consecutive years, it would go bankrupt. A Russell 2000 company can keep raising capital.
The Russell 2000’s total market capitalisation now represents only about 5.5% of the S&P 500’s, and its share of the Russell 3000 has dropped to nearly 3%—levels not seen since the 1930s. Even the “small” public companies are being dwarfed. The combined market cap of the five largest S&P 500 companies is approximately five times greater than that of the entire Russell 2000 Index.
Source: Brown Advisory analysis; Jefferies relative valuation data.
Below the Russell 2000: The Vanishing Middle
If value concentration is visible between the S&P 500 and the Russell 2000, it’s even starker when you look at the tiers below public markets. The trend is fractal—it repeats at every level of the economy.
The number of US publicly listed companies peaked at over 8,000 in 1996. By the end of 2024, that figure had fallen to under 4,000—a decline of roughly 50%. This is not because America has fewer businesses; it’s because smaller companies are increasingly staying private, being acquired, or being squeezed out entirely. Columbia Business School research finds that regulatory costs account for only about 7.3% of this decline—the real driver is the growing availability of private capital (venture capital and private equity) that allows companies to stay private, concentrating growth gains in the hands of fewer investors.
Sources: Center for Research in Security Prices; Blue Trust (8,090 peak in 1996 to 4,572 by Q1 2023); Landmark Wealth Management (~8,800 in 1997 to under 4,000 by end of 2024); Columbia Business School/Ewens & Xiao (7.3% figure); CNN Business.
At the middle-market level (firms with revenue between $10 million and $1 billion), RSM US LLP’s “Real Economy” research has documented significant consolidation over the past two decades. Meanwhile, industry concentration—measured by the Herfindahl-Hirschman Index (HHI)—has increased across over 75% of US industries since the early 2000s, according to research from NYU Stern. Firms in industries with the largest concentration increases have realised higher profit margins, suggesting that market power, not just efficiency, is driving the trend.
Sources: Grullon, Larkin & Michaely, “Are US Industries Becoming More Concentrated?” (NYU Stern/Review of Finance); RSM US LLP “Real Economy: Middle Market” reports.
Note: This finding is contested. A 2024 US Chamber of Commerce study using narrower Census Bureau industry definitions found no general trend toward increasing concentration from 2002 to 2017, with manufacturing HHI actually declining after 2007. The NBER has documented a transition from “good” concentration (efficiency-driven, associated with lower prices and higher productivity in the 1990s) to “bad” concentration (associated with higher prices, lower investment, and persistent market power since 2000). The Richmond Fed has added nuance: while national concentration is rising, local concentration is actually declining, partly because large firms entering local markets act as competitors rather than monopolists. The picture is genuinely complex, but the direction of value flow—upward toward fewer, larger entities—is consistent across most analyses.
The middle market is also being squeezed operationally. The RSM Middle Market Business Index dropped 18.7 points in Q2 2025—the second-largest decline in the survey’s ten-year history—as tariffs pushed input costs up while smaller firms lacked the financial depth to absorb them. By Q3 2025, only 37% of middle-market executives reported economic improvement, and margin compression was the dominant theme. These firms are too big to be small and too small to be big—exactly the demographic being consolidated out of existence.
The inflation dynamic is particularly revealing of the asymmetry. Large S&P 500 companies passed inflation through to customers, boosting their margins to record highs. Smaller private businesses absorbed the inflation—they lack the pricing power, market share, and brand loyalty to force price increases onto consumers without losing them. The NFIB Small Business Optimism Index has reflected this strain, with owners consistently citing cost of inputs and interest rates as their single biggest problems. The index has hovered around its long-term average but shows persistent fragility and elevated uncertainty, with the Uncertainty Index reaching 91 in early 2026.
Part 4: The Circular Economy of AI Capital
The Spending Scale
The AI infrastructure buildout is happening at a scale that has no precedent in corporate history. The five largest US hyperscalers—Amazon, Microsoft, Alphabet, Meta, and Oracle—are projected to spend between $660 billion and $700 billion on capital expenditure in 2026, nearly doubling the already historic $427 billion spent in 2025. Goldman Sachs projects total hyperscaler capex from 2025 through 2027 will reach $1.15 trillion—more than double the $477 billion spent from 2022 through 2024.
Sources: RBC Wealth Management/Bloomberg (Jan 2026 consensus estimates); Goldman Sachs; CNBC (Feb 2026 tech earnings coverage); Futurum Research.
Amazon alone expects to spend $200 billion in 2026. Alphabet is targeting up to $185 billion. Morgan Stanley estimates Amazon’s free cash flow will go negative this year—by as much as $17–28 billion, depending on the estimate—while Alphabet’s free cash flow is projected to plummet nearly 90%, from $73.3 billion in 2025 to roughly $8 billion. Capital intensity for these firms now ranges from 45–57% of revenue—levels previously associated with industrial or utility companies, not technology firms.
The Circularity Problem
The structure of AI investment has a troubling resemblance to pre-2008 financial engineering. Bloomberg, in a January 2026 investigation, documented the pattern directly: Microsoft invested over $13 billion in OpenAI, which became a major customer of Microsoft Azure. Nvidia invests up to $100 billion in OpenAI, which commits to stocking data centres with Nvidia chips. Amazon backs Anthropic with up to $15 billion; Anthropic uses Amazon Web Services for AI training. OpenAI has announced roughly $1 trillion in infrastructure commitments—$250 billion to Microsoft Azure, $300 billion to Oracle via the Stargate project, $90 billion in AMD chips, $38 billion to AWS—vastly exceeding its revenue capacity.
Sources: Bloomberg “AI Circular Deals” investigation (Jan 2026); Tomasz Tunguz analysis of OpenAI infrastructure commitments; IEEE ComSoc Technology Blog.

The top five hyperscalers raised a record $108 billion in debt during 2025 alone—more than three times the average over the previous nine years. Projections suggest $1.5 trillion in additional tech-sector debt issuance over the coming years. Some firms are using off-balance-sheet entities, including special-purpose vehicles (SPVs)—structures with, as analyst Gil Luria of D.A. Davidson warned, a “checkered history going back to Enron.” A slowdown in AI demand could render debt tied to these vehicles worthless.
The parallel to 2008 is not exact—there are no synthetic CDOs here—but the pattern is analogous: value circulating within a closed system, each node’s valuation depending on the others continuing to spend, with opacity about the ultimate source of returns. As a Deutsche Bank research report revealed, while US investment in AI-related industries surged over the past five years, non-AI investment remained stagnant. The AI boom is not lifting all boats; it may be siphoning capital from the rest of the economy.
Part 5: The Bet That Breaks Either Way
Scenario A: AI Underdelivers
If the massive capex turns out to be overbuilt—if AI generates productivity improvements but not at the scale required to justify hundreds of billions annually—the correction mechanism is straightforward. Nvidia’s revenue growth plateaus. The circular investment logic fractures when one node stops spending. The S&P 500 corrects sharply because these companies are the S&P 500 now—41% of the index is directly exposed to the AI thesis.
Recall the GDP dependency: AI capex contributed between 20% and 92% of US GDP growth in 2025, depending on the estimate. If that spending merely plateaus—not declines, just stops accelerating—GDP growth could halve. If it actually contracts, the economy enters recession, and the Fed faces the impossible choice of cutting rates to stimulate growth while inflation from tariffs and supply constraints persists.
The Wall Street Journal has already noted that AI revenue does not yet exceed AI capex. Capex now consumes 94% of operating cash flows (minus dividends and buybacks) for the top hyperscalers, up from 76% in 2024. There is almost no margin for error. If growth decelerates even modestly, the spending becomes unsustainable, and the companies will need to either cut investment (triggering a demand collapse for chip suppliers) or take on even more debt.
Scenario B: AI Delivers
This is the scenario most people assume is good news. But follow the logic through: if AI genuinely automates at scale, the productivity gains accrue to the companies deploying it. Margins explode. But the workers displaced by automation lose their incomes.
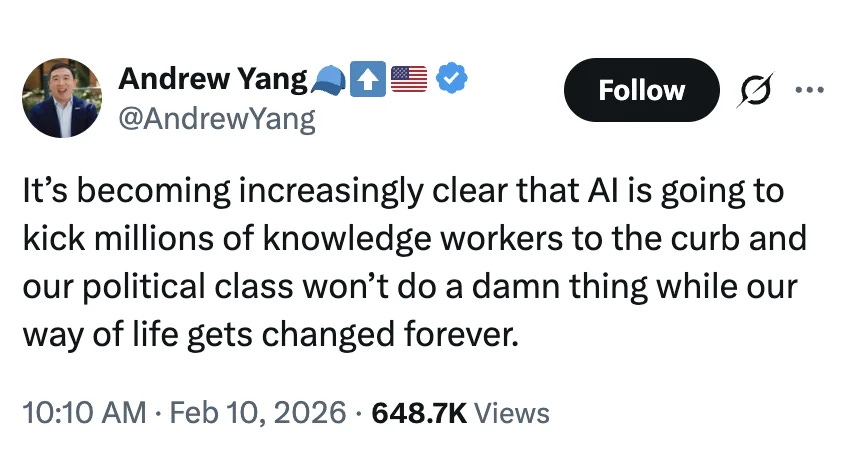
Consumer spending contracts because the people who used to buy things no longer earn money to buy them with.
The early indicators are already measurable. Stanford’s “Canaries Paper,” analysing payroll data, found a 13% drop in employment among 22–25-year-olds in AI-exposed roles since late 2022—entry-level white-collar jobs that used to serve as career stepping stones are vanishing as firms automate them. The IMF estimates AI could affect nearly 40% of global jobs, with advanced economies like the US facing 60% exposure. Challenger, Gray & Christmas reported roughly 55,000 AI-linked US layoffs in 2025, and worker fears of permanent AI-driven job loss jumped from 28% to 40% in surveys.
Anthropic’s CEO Dario Amodei has warned AI could spike unemployment 10–20% within one to five years, potentially wiping out half of entry-level white-collar positions. The World Economic Forum projects 85 million jobs lost globally by 2026 due to AI and automation, partially offset by 69 million new roles—but those new roles are skewed toward high-skill positions, widening the gap for everyone else.
Sources: Stanford “Canaries Paper” (payroll data analysis); IMF (global jobs exposure estimates); Challenger, Gray & Christmas (2025 AI layoff data); Dario Amodei public statements; World Economic Forum “Future of Jobs” report.
The result is a polarisation of wages and opportunities. Research shows that jobs requiring AI skills command 3–15% higher pay, but in regions with high AI adoption, overall employment in vulnerable occupations drops 3.6% after five years. As Brookings has documented, displaced white-collar workers compete downward, disrupting service economies and exacerbating income gaps. The gains flow to companies, not workers—widening inequality without policy intervention.
GDP might still look fine on paper—capital investment, AI-driven exports, and efficiency gains can mask the demand-side deterioration. But the domestic consumption engine, which powers roughly 70% of US GDP, stalls. The K-shaped market becomes an L-shape for the bottom.
The Demand Paradox
This is the central paradox: the bet is that AI will generate so much value that it justifies these valuations. But if it does, who’s left buying?
The velocity of M2 money—how quickly money circulates through the economy—offers a structural view of this problem. M2 velocity peaked at 2.19 in 1997 and has been in secular decline ever since, sitting at roughly 1.40 as of mid-2025. Post-2008, velocity averaged 1.4 compared to 1.9 pre-crisis. When money concentrates at the top—in corporate cash piles, AI infrastructure capex, share buybacks—and the bottom tiers have less disposable income, monetary velocity drops. This is deflationary pressure masquerading as growth. GDP goes up because of capital investment, but the circulation of money through the real economy slows.
Source: Federal Reserve Bank of St. Louis (FRED M2V series); Trading Economics (1.406 ratio, July 2025).
As economist Daniel Lacalle has noted, when 4.5% money supply growth delivers only 2.5% real GDP growth, the economy is showing that additional money is not generating a multiplier effect. Between 2021 and 2024, money supply growth generated essentially no multiplier effect on GDP—a symptom of an economy where liquidity inflates assets rather than circulating through productive activity.
Part 6: The Structural Picture
The Tier System
Putting it all together, the US economy now functions as a series of tiers where value is systematically vacuumed upward at each stage:
• Tier 1 — Magnificent Seven / Mega-Cap: Up 75–100%+ over five years. Cash-rich near-monopolies trading on AI futures. Effectively function as quasi-sovereign entities. Collectively hold over $420 billion in cash.
• Tier 2 — Rest of S&P 500: Up 50–60%. Piggybacking on the giants through index weighting. Solid balance sheets but increasingly dependent on AI-adjacent demand.
• Tier 3 — Russell 2000: Up roughly 17%. The “one percent of the losers.” Struggling but kept alive by access to public capital markets. 40–44% unprofitable. Facing a $709 billion refinancing wall in 2026–2027.
• Tier 4 — Private Middle Market: Flat to declining. Consolidating from roughly 200,000 to 125,000 firms over two decades (RSM). Margin-squeezed by tariffs and input costs. RSM MMBI showing fragility.
• Tier 5 — Main Street / Small Private Business: Fighting to exist. No access to Wall Street capital. Absorbing inflation that large firms pass through to customers. NFIB Optimism Index showing persistent fragility.
At every tier, the pattern is the same: the level above absorbs value from the level below, through acquisition, margin pressure, capital access advantages, and now, through speculative AI investment that draws institutional capital toward the top while starving the rest.
The Broken Ladder
The path from small business to public company used to be a ladder. That ladder is broken. IPO activity has collapsed—not because regulation is too burdensome (that accounts for only 7.3% of the decline, per Columbia Business School) but because private capital allows firms to stay private, concentrating gains among institutional investors. The Wilshire 5000, which once tracked 5,000 equities, now covers only about 3,600. The number of public companies is lower today than it was in the early 1970s, when real GDP was one-third of current levels.

For everyday investors—the retail participants who are supposed to benefit from economic growth through public market participation—the pool of accessible opportunities is shrinking. As Columbia’s Kairong Xiao put it, the growth of the next big successful companies may end up benefiting only a few venture capital and private equity investors.
Conclusion: The K Becomes an L
The US economy is not broken in the sense that GDP is falling or markets are crashing. It is broken in a more structural way: the mechanism through which growth is supposed to diffuse through society—from corporate profits to wages to consumer spending to business revenue—is increasingly short-circuited.
Value flows upward through market concentration, AI-driven capital allocation, and passive index mechanics. It pools at the top in the form of cash reserves, speculative capex, and inflated valuations. And it doesn’t come back down—not through wages (which lag productivity), not through investment in the broader economy (which is stagnant outside AI), and not through public market access (which is shrinking).
The S&P 500 is measuring the AI economy of the future. The Russell 2000 is measuring the physical economy of today. And everything below the Russell 2000—the middle market, Main Street, the actual workforce—is barely visible in any index at all.
The core paradox remains: this AI-fuelled P/E premium feels like betting the farm on a future where automation wins big. But if automation wins, it wins by replacing the people whose spending powers the economy. And if it doesn’t win, we’ve allocated hundreds of billions in capital to infrastructure that doesn’t generate returns, financed by circular investments and record debt.
Either way, the structure is unstable. The question is not whether a correction comes, but what form it takes—and whether the tiers below the top have any resilience left when it does.
Epilogue
Privatising Profits, Socialising Losses
A Note on Speculation
Much of this article is, necessarily, speculative. We are connecting data points across indices, industries, and policy domains to describe a pattern that is still unfolding. The future is uncertain—AI may deliver transformative productivity gains that somehow resolve the demand paradox; markets may correct gently rather than violently; policy interventions may redistribute value before the problems become crises. We do not claim to know which scenario will play out.
But we are not speculating in a vacuum. We are speculating in the same way that history has shown us these patterns tend to resolve—and the pattern recognition is uncomfortable.
The Pattern
Every major financial crisis of the past century has shared a common architecture: a new technology or financial innovation generates genuine excitement; that excitement attracts speculative capital; the speculation becomes self-reinforcing through leverage, circular investment, and the conviction that “this time is different”; the insiders profit on the way up; and when the correction comes, the losses are distributed downward—to taxpayers, workers, pension funds, and small investors—while the architects of the bubble retain most of their gains.
The 1920s railroad and industrial bubble ended in the 1929 crash, followed by breadlines for workers while financiers retained their estates. The dot-com bubble of 1998–2000 saw trillions in retail investor wealth evaporate while venture capitalists had already cashed out through IPOs. The 2008 financial crisis—the closest analogue to today—saw banks package opaque, circular financial products, book enormous profits, and then receive $700 billion in TARP bailout funds when the structure collapsed. Executives at the firms that caused the crisis received hundreds of millions in bonuses in the year following the bailout. Homeowners lost their houses.
In each case, the critical ingredients were the same: opacity about the true source of returns, leverage that amplified both gains and losses, circular wheels where entities were simultaneously customers, investors, and suppliers to each other, and—crucially—a conviction among insiders that the bet was too important to fail, which laid the groundwork for public rescue when it did.

There is a reasonable question about whether what we are seeing in the AI economy today is something genuinely different—a technological revolution so profound that the old patterns don’t apply. That question deserves honest engagement. But it is worth noting that the same question was asked about railroad stocks in the 1920s, about internet commerce in 1999, and about financial engineering in 2006. In each case, the underlying technology did ultimately prove transformative. The railroads did reshape the economy. The internet did change everything. Structured finance did have legitimate applications. The technology being real does not prevent the speculation from being a bubble. These two things have always coexisted.
The Humility Gap
What has historically precipitated the crash is not that insiders were wrong about the technology. It is that they lacked humility about the valuation. Every bubble is characterised by a moment where the people making the bets stop asking “what if this doesn’t work?” and start assuming it will—and structuring their finances accordingly. The dot-com CEOs weren’t wrong that the internet would be big. They were wrong that their particular business model was worth 500 times revenue. The 2008 bankers weren’t wrong that housing was important. They were wrong that housing prices could never decline nationally.
Today, the AI companies are not wrong that AI will be important. The question is whether they’re wrong about the timeline, the scale of returns, or the structure of the bet.
When OpenAI commits to $1.4 trillion in infrastructure spending while losing $13.5 billion in the first half of 2025 alone; when hyperscalers raise $108 billion in debt in a single year to fund capex that may not generate returns for a decade; when the circular investment structures mean that each company’s revenue is, in part, another company’s capex—the question of humility becomes urgent.

Sam Altman captured the tension perfectly in December 2025 when he simultaneously declared the market “overexcited” about AI and AI “the most important thing to happen in a very long time.” That is not a contradiction. But it is an acknowledgment that the people at the centre of the bubble can see it, and are building anyway. The question is whether they’re building for everyone, or building for themselves—and who pays if the foundations crack.
What Has the Number Going Up Actually Given Us?
Set aside the financial architecture for a moment and ask a simpler question: the S&P 500 has risen over 800% in its lifetime. What has that growth delivered to the average person?
The platform economy that powered this ascent was supposed to connect us. Has social media improved social lives and wellbeing? The evidence is overwhelmingly negative: rising rates of anxiety, depression, and loneliness—particularly among young people—have tracked almost precisely with smartphone and social media adoption. The platforms that generated trillions in market capitalisation did so by capturing attention, not by improving the lives of the people whose attention they captured.
Corporate consolidation was supposed to bring efficiency and lower prices. Has it? High streets and town centres have hollowed out across America as local businesses were replaced by national chains, which were in turn replaced by e-commerce platforms that employ a fraction of the people. Choice has narrowed in many sectors even as the illusion of choice—scrolling through algorithmically curated product listings—has expanded. The HHI data tells the story; anyone who has watched their local economy over the past two decades can tell it from experience.
Housing—the primary store of wealth for most American families—has become a speculative asset class. Median home prices have risen far faster than median incomes. Rent consumes an ever-growing share of household budgets.
The financialisation of housing has been accelerated by the same institutional capital that flows through the market tiers described in this article: private equity firms buying single-family homes, REITs consolidating rental properties, and the sheer volume of capital chasing returns in an environment where productive investment in the broader economy is stagnating.
The national debt has grown from roughly $10 trillion in 2008 to over $36 trillion today. Tax cuts have disproportionately benefited corporations and high-income earners—the 2017 Tax Cuts and Jobs Act permanently reduced the corporate tax rate from 35% to 21%, while individual cuts are scheduled to expire. The wealth generated by the S&P 500’s ascent has accrued overwhelmingly to the top decile of households, who own approximately 93% of all stocks.
And here is the question that sits beneath all the financial analysis in this article: is a dollar the same thing to someone who needs it to eat as it is to someone who can bet it on the future of humanity and not feel the loss? The entire AI infrastructure boom—the $700 billion in annual capex, the $1.4 trillion in OpenAI commitments, the circular investments, the record debt—represents capital being deployed by people for whom the downside is a writeoff, not a catastrophe. When the bet fails, or when it succeeds in ways that eliminate jobs, the people who made the bet will be fine. They have always been fine. In 2008, the architects of the crisis received bonuses while homeowners were foreclosed on.
The Backstop
Which brings us, finally, to the most revealing data point of all.
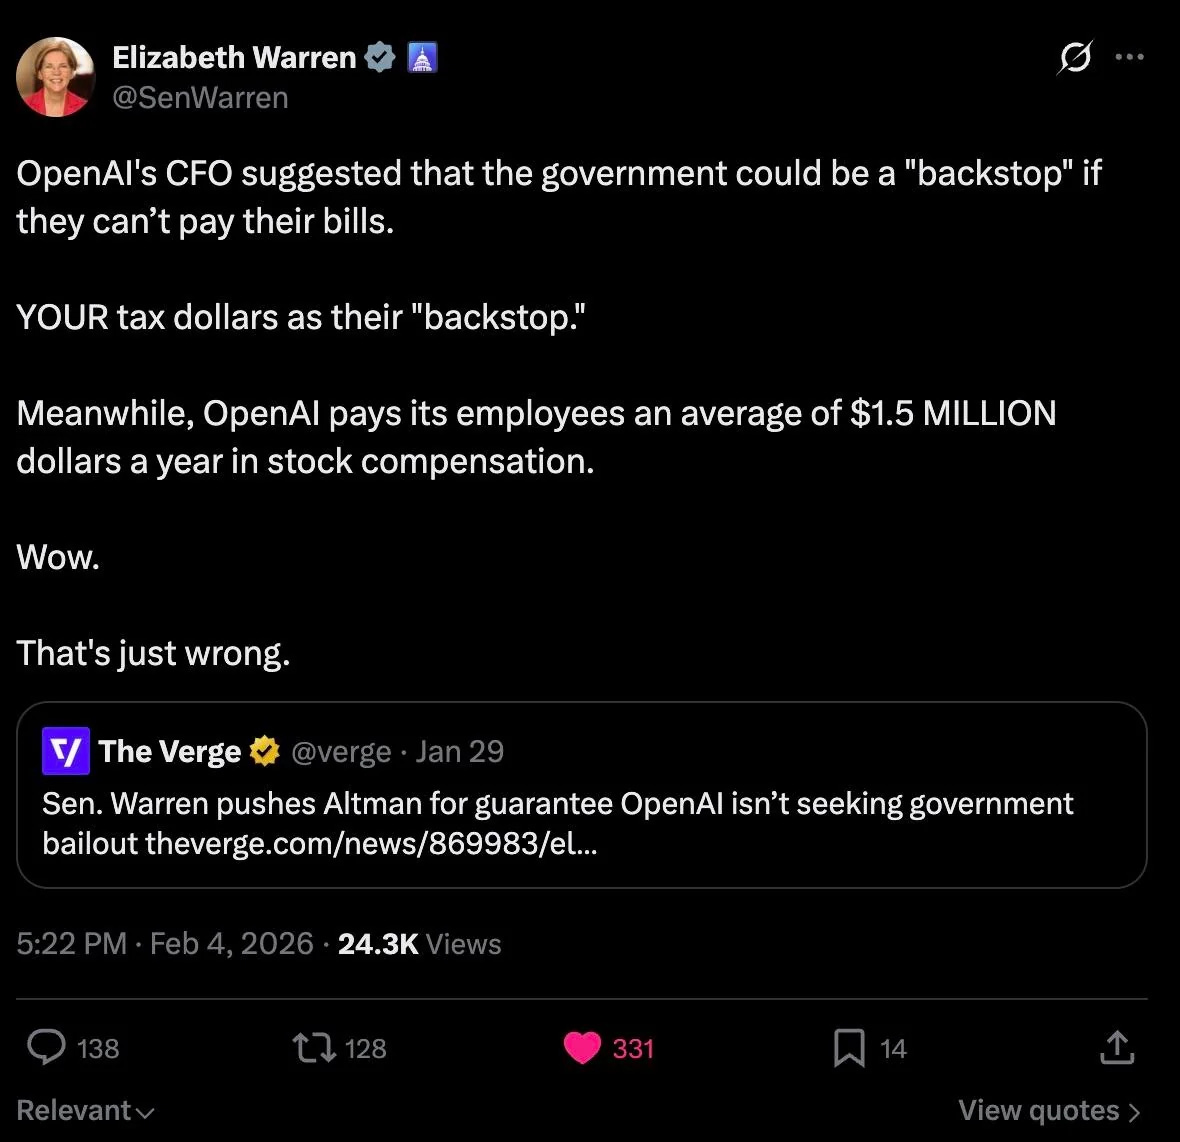
In November 2025, OpenAI’s CFO Sarah Friar publicly suggested that the US federal government should provide a “backstop”—loan guarantees for the company’s massive AI data centre investments—to help lower financing costs. The statement was quickly walked back after public backlash. David Sacks, acting as a technology advisor for the Trump administration, stated there would be no federal bailout for AI. Friar clarified she had meant to highlight the need for public-private collaboration, not a direct bailout. CEO Sam Altman stated that OpenAI does not have and does not want government guarantees.
But the request had been made. And it was not an isolated incident. In March 2025, OpenAI sent a letter to the White House advocating for tax credits, loans, and other government vehicles for companies building AI infrastructure. In October, the company requested that Congress extend semiconductor tax credits to the broader AI supply chain. As Senator Elizabeth Warren documented in a January 2026 letter to Altman, the company is “privatising profits while seeking ways to let the public defray the costs of any potential failures of its business strategy.”
Sources: Senator Elizabeth Warren, letter to OpenAI CEO Sam Altman (29 Jan 2026); OpenAI letters to OSTP (March and October 2025); Sarah Friar public interview (November 2025).
This is happening while OpenAI is losing money faster than almost any startup in Silicon Valley history—$13.5 billion in the first half of 2025 alone—and while the company reportedly pays employees an average stock compensation of $1.5 million each. The company is simultaneously asking taxpayers to backstop its infrastructure bets and compensating its employees at levels that dwarf the median American household income by a factor of twenty.
The pattern is complete. The technology is real. The speculation is enormous. The profits flow upward. And when the downside risk becomes too large for the private sector to bear, the first instinct is to ask the public to carry it.
This is not new. This is exactly what happened in 2008. And in 2000. And in 1929. The technology changes; the architecture of risk transfer does not.
The number is going up. The question we should all be asking is: for whom?
The Gambler’s Fallacy

The "Gambler's Fallacy" is a systemic pathology where successful individuals misattribute outcomes solely to their own “genius,” ignoring the critical roles of luck, timing, and privilege.
Key Sources & References
AI & GDP Dependency
• Deutsche Bank Research — Non-AI investment stagnation amid AI capex surge (2025).
• Goldman Sachs — AI capex contribution to US GDP growth estimates (2025).
• Multiple analyst estimates (compiled) — AI contribution to GDP ranging from 20–92% in H1 2025.
• Industry reports — Data centre construction growth exceeding 400% since 2019.
Market Concentration
• RBC Wealth Management, “The Great Narrowing: S&P 500 Concentration” (Jan 2026). Data as of 12/31/25, FactSet.
• Wikipedia, “S&P 500” — Top 10 component weightings as of January 2026.
• S&P Dow Jones Indices — S&P 500 aggregate market cap exceeding $61.1 trillion (Dec 2025).
Small-Cap / Russell 2000
• Apollo Global Management (Torsten Slok) — 40% unprofitable companies, cited in Yahoo Finance/Fortune (Oct 2025).
• Morgan Stanley (Lisa Shalett) — Small-cap cost of capital exceeding return on assets (Oct 2025).
• Bank of America (Subramanian et al.) — S&P 500 “frothy to bubbly” on 9 of 20 metrics (Oct 2025).
• Brown Advisory, “Small Wonders: Embracing US Small Caps.”
• Investing.com — Russell 2000 refinancing wall: $709B due 2026-2027 (Nov 2025).
• FinancialContent/WRAL — Russell 2000 18% surge post-CPI (Feb 2026).
AI Capital Expenditure
• RBC Wealth Management/Bloomberg — Big Tech capex projections 2025–2027 (Jan 2026 consensus estimates).
• Goldman Sachs — Hyperscaler capex $1.15T projected 2025–2027.
• CNBC — “Tech AI spending approaches $700 billion in 2026” (Feb 2026).
• Bloomberg — “AI Circular Deals: How Microsoft, OpenAI and Nvidia Keep Paying Each Other” (Jan 2026).
• IEEE ComSoc Technology Blog — AI spending boom, $400B in 2025. Circular deal and SPV analysis.
• Tomasz Tunguz — OpenAI’s $1 trillion infrastructure commitments breakdown.
• Futurum Research — “AI Capex 2026: The $690B Infrastructure Sprint” (Feb 2026).
• Introl Blog — $108B hyperscaler debt raised in 2025; $1.5T projected (Jan 2026).
Industry Concentration
• Grullon, Larkin & Michaely, “Are US Industries Becoming More Concentrated?” Review of Finance (NYU Stern). HHI increase in 75%+ of industries.
• US Chamber of Commerce / AEI — “Industrial Concentration in the United States: 2002–2017” (2024). Counter-finding: no general trend toward increased concentration using narrow Census definitions.
• Gutiérrez & Philippon, “From Good to Bad Concentration?” NBER Macroeconomics Annual, Vol 34.
• Richmond Fed — “Diverging Trends in National and Local Concentration” (2024/2025).
Public Company Decline & Middle Market
• Blue Trust — US listed companies: 8,090 peak (1996) to 4,572 (Q1 2023).
• Landmark Wealth Management — ~8,800 in 1997 to under 4,000 by end of 2024.
• Columbia Business School (Ewens & Xiao) — Regulatory costs account for 7.3% of IPO decline.
• RSM US LLP / US Chamber of Commerce — Middle Market Business Index quarterly reports (2025).
• RSM US LLP — “The Real Economy: Middle Market” reports.
Monetary Velocity
• Federal Reserve Bank of St. Louis (FRED) — Velocity of M2 Money Stock (M2V series).
• Trading Economics — M2 velocity at 1.406 (July 2025); record high 2.192 (July 1997).
• Daniel Lacalle, “Excessive Money Supply Growth Creates Secular Stagnation” (2025).
AI & Employment
• Sam Altman — December 2025 statement on AI overexcitement.
• France-Epargne Research — “State of AI 2026: Comprehensive Market & Technology Analysis” (Dec 2025).
• Stanford “Canaries Paper” — 13% employment drop for 22–25-year-olds in AI-exposed roles since late 2022.
• IMF — AI affecting ~40% of global jobs; 60% exposure in advanced economies.
• Challenger, Gray & Christmas — ~55,000 AI-linked US layoffs in 2025.
• Dario Amodei (Anthropic) — 10–20% unemployment risk within 1–5 years; public statements.
• World Economic Forum — “Future of Jobs” report: 85M jobs lost vs 69M created by 2026/2028.
• Brookings Institution — AI displacement dynamics and downward labour competition.
• NFIB Small Business Optimism Index — Long-term average ~98; Uncertainty Index at 91 (Jan 2026).
Epilogue: Government Backstop & Historical Parallels
• Senator Elizabeth Warren — Letter to OpenAI CEO Sam Altman (29 January 2026). warren.senate.gov.
• OpenAI CFO Sarah Friar — Public interview suggesting government “backstop” for AI infrastructure (November 2025).
• OpenAI — Letters to White House OSTP requesting tax credits and loan guarantees (March and October 2025).
• David Sacks (Trump AI/Crypto Advisor) — Statement: “No federal bailout for AI” (November 2025).
• OpenAI financial disclosures — $13.5B losses in H1 2025; average employee stock compensation $1.5M.
• US national debt data — Treasury Department (~$36T as of 2025).
• Federal Reserve Survey of Consumer Finances — Top 10% of households own ~93% of stocks.
Truly appreciate the great article, clearly showing the current situation is worth worrying about: "The core paradox remains: this AI-fuelled P/E premium feels like betting the farm on a future where automation wins big. But if automation wins, it wins by replacing the people whose spending powers the economy. And if it doesn’t win, we’ve allocated hundreds of billions in capital to infrastructure that doesn’t generate returns, financed by circular investments and record debt."
I arrived to this write up following a recommendation from Dr. Burry. Absolutely a wonderful read, and both eye opening and terrifying at the same time. I was in my late teens when the .com bubble popped, and in my mid to late 20s when the GFC happened. The similarities are hard to ignore, yet I feel not much I can do. Too much noise in the system, and distracting. Even holding cash feels defeating. Excellent article.